We have already discussed bibliometric measures for the mathematics corpus in this column before. This included the unusual longevity of mathematics citations, effects of delayed publication due to often long and complex refereeing processes, and the specifics of different mathematical areas. It has become clear that purely numerical criteria are often unsuitable to measure mathematical quality or the scientific impact of publications. At the same time, the bibliometric results often depend on mathematical subfields, thus reflecting the structure and different behaviour of mathematical communities. In this column we concentrate on an author-oriented viewpoint. We will derive some quantities which illustrate how the landscape of mathematical publications has changed over the past decades.
1 Introduction
Evaluations and rankings, be it of individuals or institutions, have become part of academic reality. These evaluations range from career-defining assessments of individuals to worldwide university rankings. Although the methodology of many of these evaluations has often been criticised, they remain ubiquitous with extraordinary effects. The effect on individual careers and hence lives can be decisive. On a more global level, these figures not only contribute significantly to the reputation of universities, but also affect the choices of perspective students.
Various parameters are used to evaluate research performance, with bibliometric data playing an important role in (almost) all evaluations. Generating these data, as well as interpreting them, constitutes a major challenge. Therefore, it is important to understand the technical aspects, as well as the different parameters and perspectives, that go into bibliometric data.
In previous articles [2 A. Bannister and O. Teschke, An update on time lag in mathematical references, preprint relevance, and subject specifics. Eur. Math. Soc. Newsl. 106, 41–43 (2017) , 1 A. Bannister, K. Hulek and O. Teschke, Das Zitationsverhalten in mathematischen Arbeiten: Einige Anmerkungen. Mitt. Dtsch. Math.-Ver. 25, 208–214 (2017) , 3 T. Bouche, O. Teschke and K. Wojciechowski, Time lag in mathematical references. Eur. Math. Soc. Newsl. 86, 54–55 (2012) ], we reported in particular that mathematics citations have an unusually long lifespan compared to other sciences. Taking this into account, together with the often time-consuming refereeing and publication processes, renders useless the measures that count only recent citations (like the traditional impact factor). Also, a strong correlation between the quality of a journal, as assessed by peers, and relative citation counts could not be corroborated. We also see a significant influence of the publication behaviour of mathematicians as compared to other scientists, such as physicists or computer scientists. In fact, publication attitudes also vary significantly, depending on different fields of mathematics.

While our previous analysis was mostly document-based, it is also worthwhile taking a more author-centred point of view when analysing publication behaviour. Such an analysis, however, requires extremely precise authorship data, since otherwise error propagation would disturb any derived quantities, making meaningful conclusions impossible. In this study, we take advantage of the significant progress of the zbMATH Open author disambiguation during the past years. Methods and progress on this matter have been amply described in previous columns [13 O. Teschke and B. Wegner, Author profiles at Zentralblatt MATH. Eur. Math. Soc. Newsl. 79, 43–44 (2011) , 9 H. Mihaljević-Brandt and N. Roy, zbMATH author profiles: open up for user participation. Eur. Math. Soc. Newsl. 93, 53–55 (2014) ]. Nevertheless, we would like to mention that currently only roughly 3.5% of authorships are ambiguous (compared to 5% in 2018), despite the growing ratio of authorships involving Chinese names, which cause the most complicated disambiguation tasks. Most large clusters of Chinese names have now been successfully analysed (e.g., 1,529 documents involving the most frequent single name Wang, Wei have been distributed to currently 366 identities). The by now highly efficient author disambiguation will help to eliminate distortions in the subsequent analysis (which will take into account only the 96.5% of unambiguous assignments).
We will first employ the zbMATH Open author database to derive figures on the number of actively publishing mathematicians in a given year. Comparing this with the growth of documents, some effects showing changing publication frequency and collaboration behaviour will become visible. With the assignment of MSC (Mathematical Subject Classification) classes since the 1970s, it is possible to analyse and compare these figures for different mathematical areas. For convenience (and to achieve some historical coherence, avoiding effects from the evolution of MSC) this is done for a set of ten clusters of main MSC classes, which were also employed in previous studies, such as [10 H. Mihaljević-Brandt and O. Teschke, Journal profiles and beyond: What makes a mathematics journal “general”? Eur. Math. Soc. Newsl. 91, 55–56 (2014) , 11 N. Schappacher, Framing global mathematics: The International Mathematical Union between theorems and politics. Springer, Cham (2022) ].
2 What defines and how large are the mathematics communities?
Zentralblatt für Mathematik und ihre Grenzgebiete (now zbMATH Open, [7 K. Hulek and O. Teschke, The transition of zbMATH towards an open information platform for mathematics. Eur. Math. Soc. Newsl. 116, 44–47 (2020) ]) started in 1931 with the aim of indexing the relevant mathematical research literature in a timely fashion, including related areas of applications. Its indexing and editorial policy differed notably from the earlier Jahrbuch über die Fortschritte der Mathematik (JFM), the main difference being the quicker (though somewhat less systematic) and more international approach [15 O. Teschke, The “Jahrbuch über die Fortschritte der Mathematik” as a part of zbMATH Open. Eur. Math. Soc. Mag. 122, 62–64 (2021) ]. In effect, there are notable differences in the scope of both services, complicating historical comparisons. Since most of the subsequent analysis will involve the Mathematical Subject Classification, which has only been available in a comprehensive form for the data starting from around 1970, we will thus omit the JFM data here.

While the scope of zbMATH has remained largely unchanged over the decades, two adjustments, which are also visible at the level of document counts, should be mentioned: Firstly, the explosion of computer science publications starting at the beginning of the 2000s, required a more precise indexing policy in the MSC area 68. Secondly, after 2010 the number of “mathematical” publications has skyrocketed. This is partly, but not exclusively, due to the growing activity of so-called predatory publishers; see [14 O. Teschke, Green, gold, platinum, nickel: On the status of open access in mathematics. Eur. Math. Soc. Newsl. 110, 60–63 (2018) ] for some discussions. This has led to a stricter indexing policy requiring genuinely new mathematical results.
When one focuses on author counts, instead of publication numbers, one has to keep in mind that the distribution of papers is extremely biased. As shown in Figure 1, about 44% of the authors indexed in zbMATH Open are connected with just one publication. The median author has 2 publications, while the average publication number is about 7.9, with the highest number of publications for a single author being 1769.
There are many reasons why many authors are only connected with one paper. The obvious one is a short career in academia, often just a PhD thesis and one paper derived from this. Other people may have longer careers in research, but may switch to application areas, where they drop out of the scope of zbMATH Open. This makes it harder to define the community of scientists who actively publish mathematics research at a given moment. To make the diagram more meaningful, we add also the figures of mathematicians having more than 2 (the median) overall publications, and more than 9 overall publications, see Figure 2. The last figure excludes, by its very nature, many younger established mathematicians, explaining the decrease of the numbers for recent years.
In spite of the possible methodological issues discussed above, two trends are clearly visible: (1) the number of active authors grows much quicker than the overall number of publications, and (2) the number of established researchers with a larger number of papers grows much slower.
3 Collaboration behaviour and subject-based figures
As the comparison of the document and author numbers in Figure 2 shows, there is a discrepancy between the growth of documents and that of actively publishing mathematicians. Two main effects can conceivably play a role here – the publication frequency and the collaborative behaviour. Due to the large number of authors with very few papers, a detailed analysis of the publication frequency is highly complicated, especially since it then seems appropriate to also involve an analysis of the length of the publications in such a study.
The overall length of publications has actually been decreasing. But this phenomenon is due to the shrinking role of books as shown in Figure 3. Papers in journals have in fact become longer, at least in some areas [5 E. Dunne, Are math papers getting longer? Web blog post in Beyond Reviews: Inside MathSciNet, American Mathematical Society (14 October 2021) https://blogs.ams.org/beyondreviews/2021/10/14/are-math-papers-getting-longer/]. Further effects here come from the replacement of printed by fully electronic versions and from different journal policies. Again, this makes a more detailed analysis, which would also need to involve the journal status, as well as the area, quite demanding and thus be beyond the scope of this short note. In other sciences a tendency to split results into smallest publishable units has been reported. At this stage our data do not allow us to draw substantiated conclusions on this for mathematics.
We will, however, see that the changing collaboration behaviour is likely to be a major factor in the increased growth of the number of authors. Historically, mathematical publications were predominantly single-authored. Recently, this has changed significantly, following similar trends in other sciences. Though the overall effect is strongly driven by application areas, the phenomena are visible throughout mathematics. For a subject-specific analysis, we employ the following distribution into mathematical subdomains, as employed in [10 H. Mihaljević-Brandt and O. Teschke, Journal profiles and beyond: What makes a mathematics journal “general”? Eur. Math. Soc. Newsl. 91, 55–56 (2014) , 11 N. Schappacher, Framing global mathematics: The International Mathematical Union between theorems and politics. Springer, Cham (2022) ]:
Gen: General Mathematics; History; Foundations. This corresponds to sections 00, 01, 03, 06, 08, and 18 of the Mathematics Subject Classification MSC
Disc: Discrete Mathematics. Convex Geometry; MSC sections 05, 52
NTAG: Number Theory. Algebra. Algebraic Geometry. Group theory; MSC sections 11, 12, 13, 14, 15, 16, 17, 19, 20
Ana: Real and Complex Analysis; MSC sections 26, 28, 30, 31, 32, 33, 40, 41.
OpTh: Harmonic and Functional Analysis; Operator Theory; MSC sections 42, 43, 44, 46, 47.
DIEq: Differential and Integral equations; MSC sections 34, 35, 37, 39, 45.
OptCS: Optimization. Numerical Analysis. Computer Science. Algorithms; MSC sections 49, 65, 68, 90, 93, 94.
ProbStat: Probability Theory and Statistics. Applications to Economics, Biology and Medicine; MSC sections 60, 62, 91, 92.
TopGeom: Topology and Geometry; MSC sections 22, 51, 53, 54, 57, 58.
MaPh: Mathematical Physics; MSC sections 70, 74, 76, 78, 80, 81, 82.
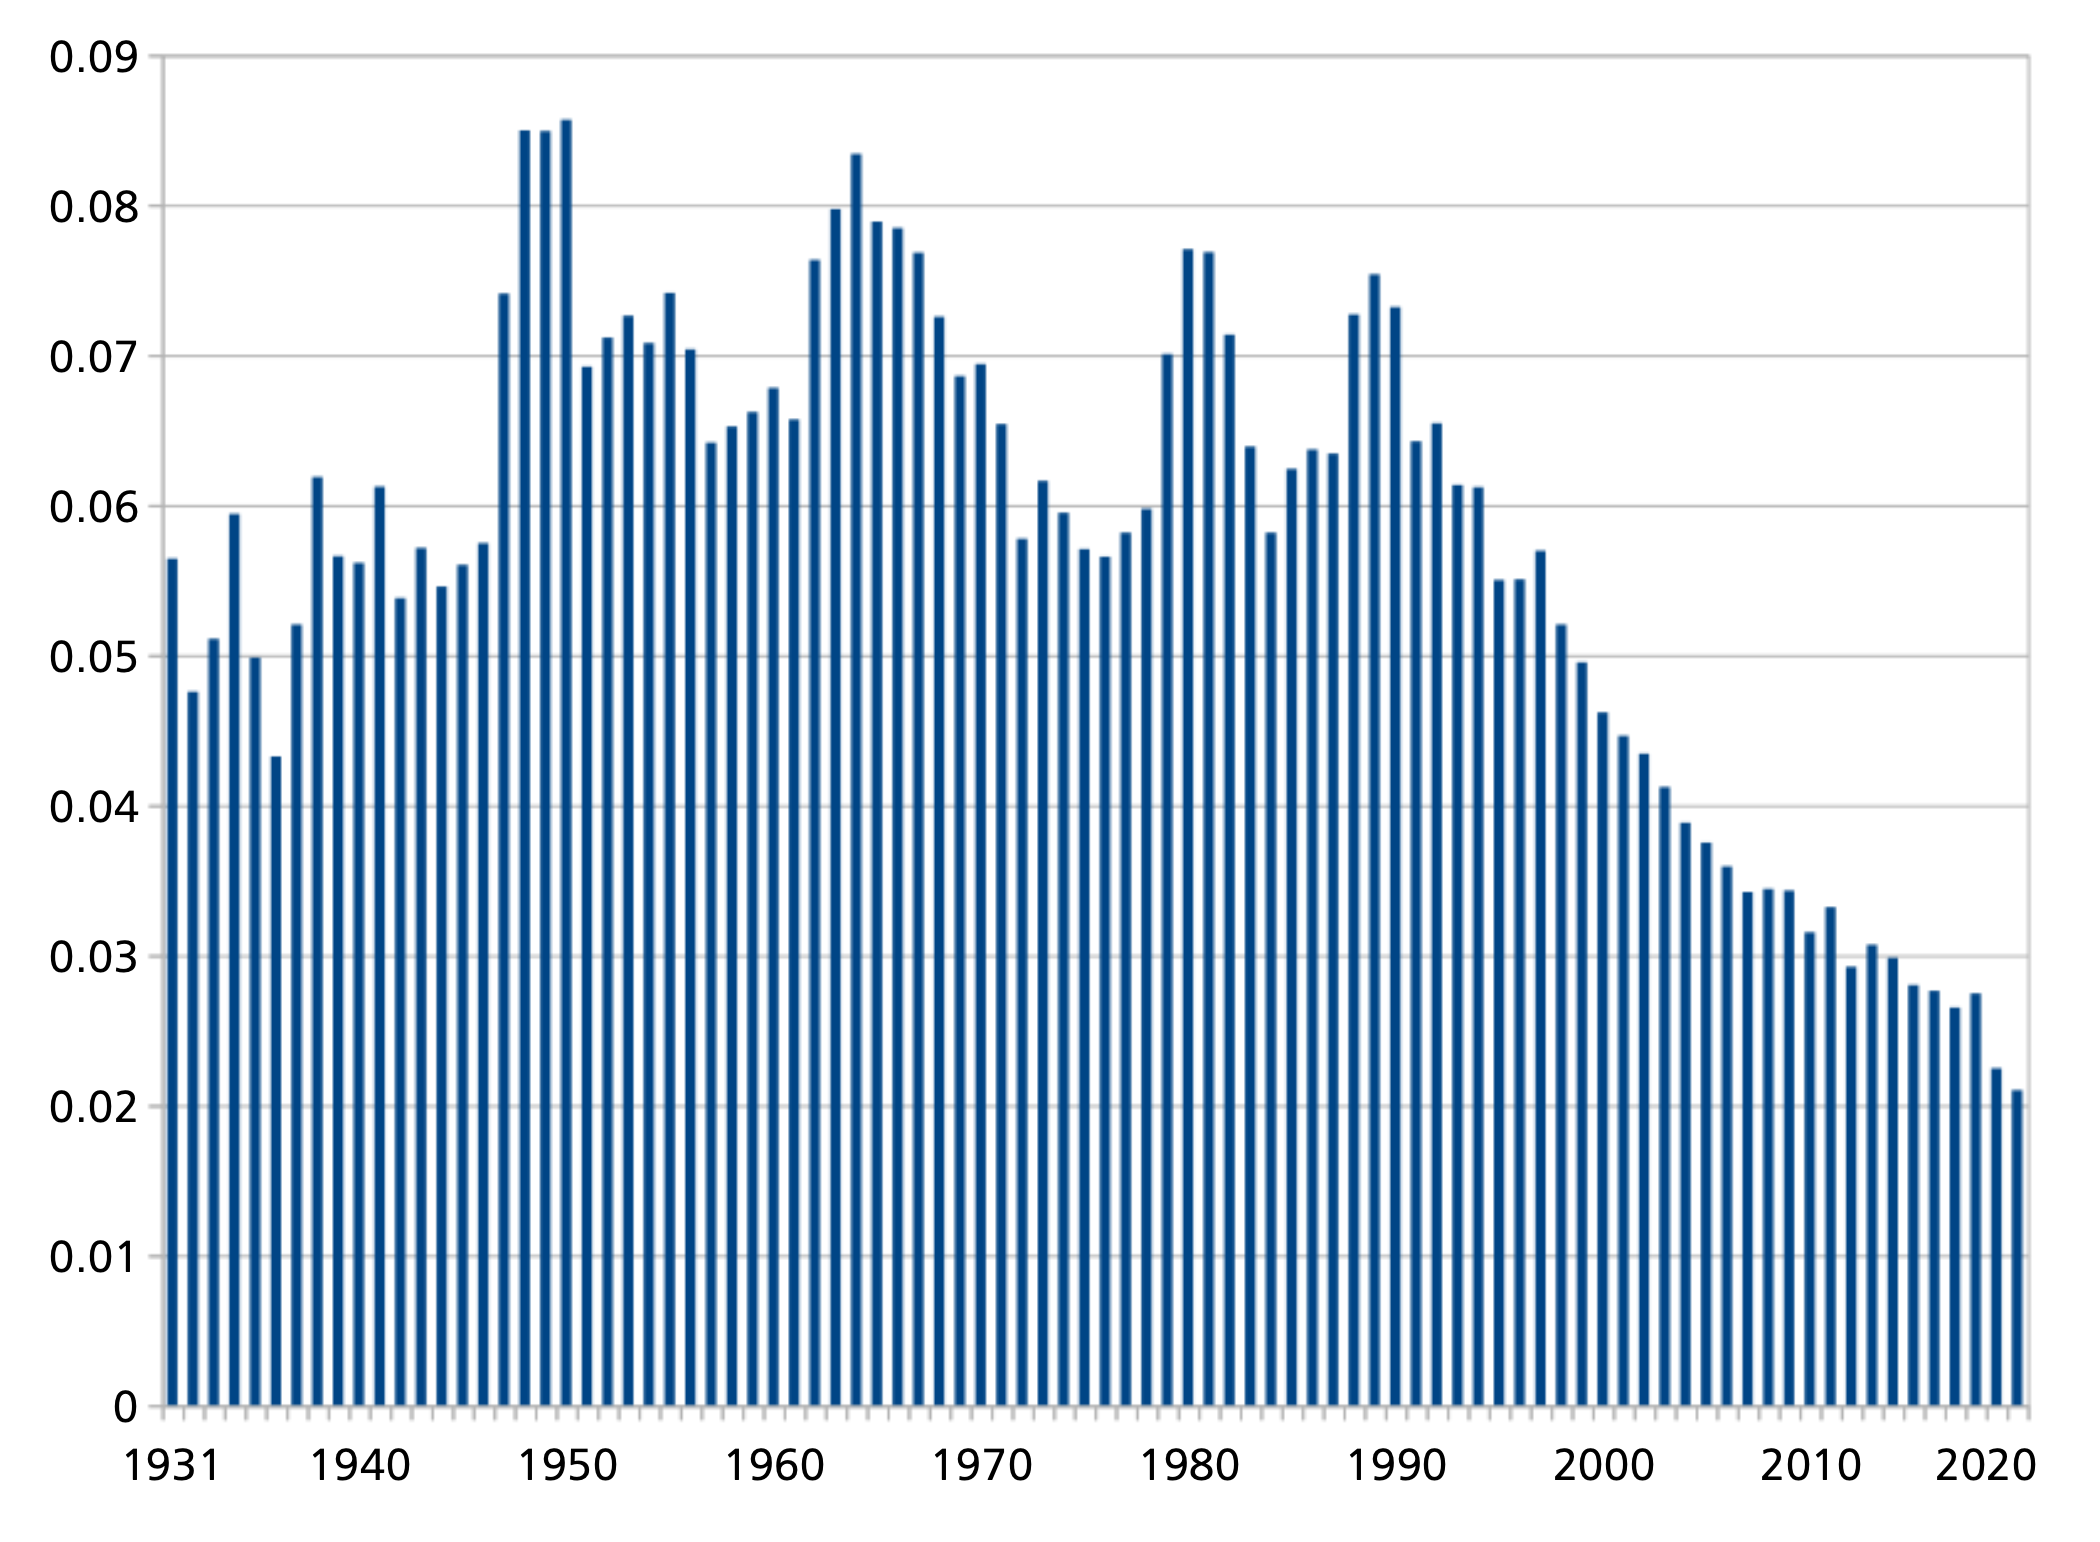
The corresponding diagram of the average number of authors per publication for the calendar years looks as follows:
There are significant differences between different clusters. Examples are given by OptCS (where the average now exceeds 4), MaPh, or ProbStat (almost 3.5) and TopGeom or NTAG (about 2.2). In spite of this, however, the overall tendency is clear – collaboration has significantly increased in all fields. With mathematics being a very international enterprise, this seems to hold true globally, although samples indicate that figures may differ geographically; this may be explained both by area correlation or national science policies. However, such an analysis would again exceed the space of this column, and is left for subsequent studies.
Analogously, a breakdown can be made of the actively publishing mathematicians in each field:

There is a small caveat here – actively publishing mathematicians are evaluated separately for each area, so in the cumulative display, people active in several clusters may appear several times (the comparison with Figure 2 shows that this effect amounts to an about 20% increased height).


The same evaluation can be made for authors with at least 2 and at least 9 publications (see Figures 6 and 7) to obtain an impression on the more stable core of the respective communities. It can be seen that the extreme overall growth in authorships in some areas during the last decades is less extreme when authors with few papers are filtered out. Since the strong growth is concentrated in areas with likewise high collaboration figures, a possible explanation is that the numbers are inflated by many people who appear just a few times as additional coauthors.
Summarizing, we can say that the publication behaviour has clearly changed throughout mathematics towards a more collaborative attitude, but the intensity with which this happens is somewhat different in different areas.
4 Citation and coauthor networks
Another aspect, which is relevant in connection with the observed increased collaboration, is the question as to how citations are distributed within the coauthor network. Although it is for many reasons clear that mathematical achievements cannot be compared on the basis of simple (especially, short-term) citation counts (cf. [2 A. Bannister and O. Teschke, An update on time lag in mathematical references, preprint relevance, and subject specifics. Eur. Math. Soc. Newsl. 106, 41–43 (2017) , 1 A. Bannister, K. Hulek and O. Teschke, Das Zitationsverhalten in mathematischen Arbeiten: Einige Anmerkungen. Mitt. Dtsch. Math.-Ver. 25, 208–214 (2017) , 3 T. Bouche, O. Teschke and K. Wojciechowski, Time lag in mathematical references. Eur. Math. Soc. Newsl. 86, 54–55 (2012) ]), there is still a prevailing notion that some (possibly vaguely defined) impact is correlated with aggregated citations. For a better understanding of what citations reflect, we would here suggest a first step into an empirical analysis of their distribution in the collaboration network. Although there have been suggestions of a bibliometric index involving collaboration distances [4 M. Bras-Amorós, J. Domingo-Ferrer and V. Torra, A bibliometric index based on the collaboration distance between cited and citing authors. J. Informetrics 5, 248–264 (2011) ], it appears that such approaches have never been applied to real-world databases. One reason might be that such an analysis requires very precise authorship data, since otherwise the error propagation would lead to ever more unreliable results as the coauthor distance grows. In bibliometrics, the discussion is mostly restricted to the zero level (i.e., a possible exclusion of self-citations). This is unlikely to provide a comprehensive understanding.
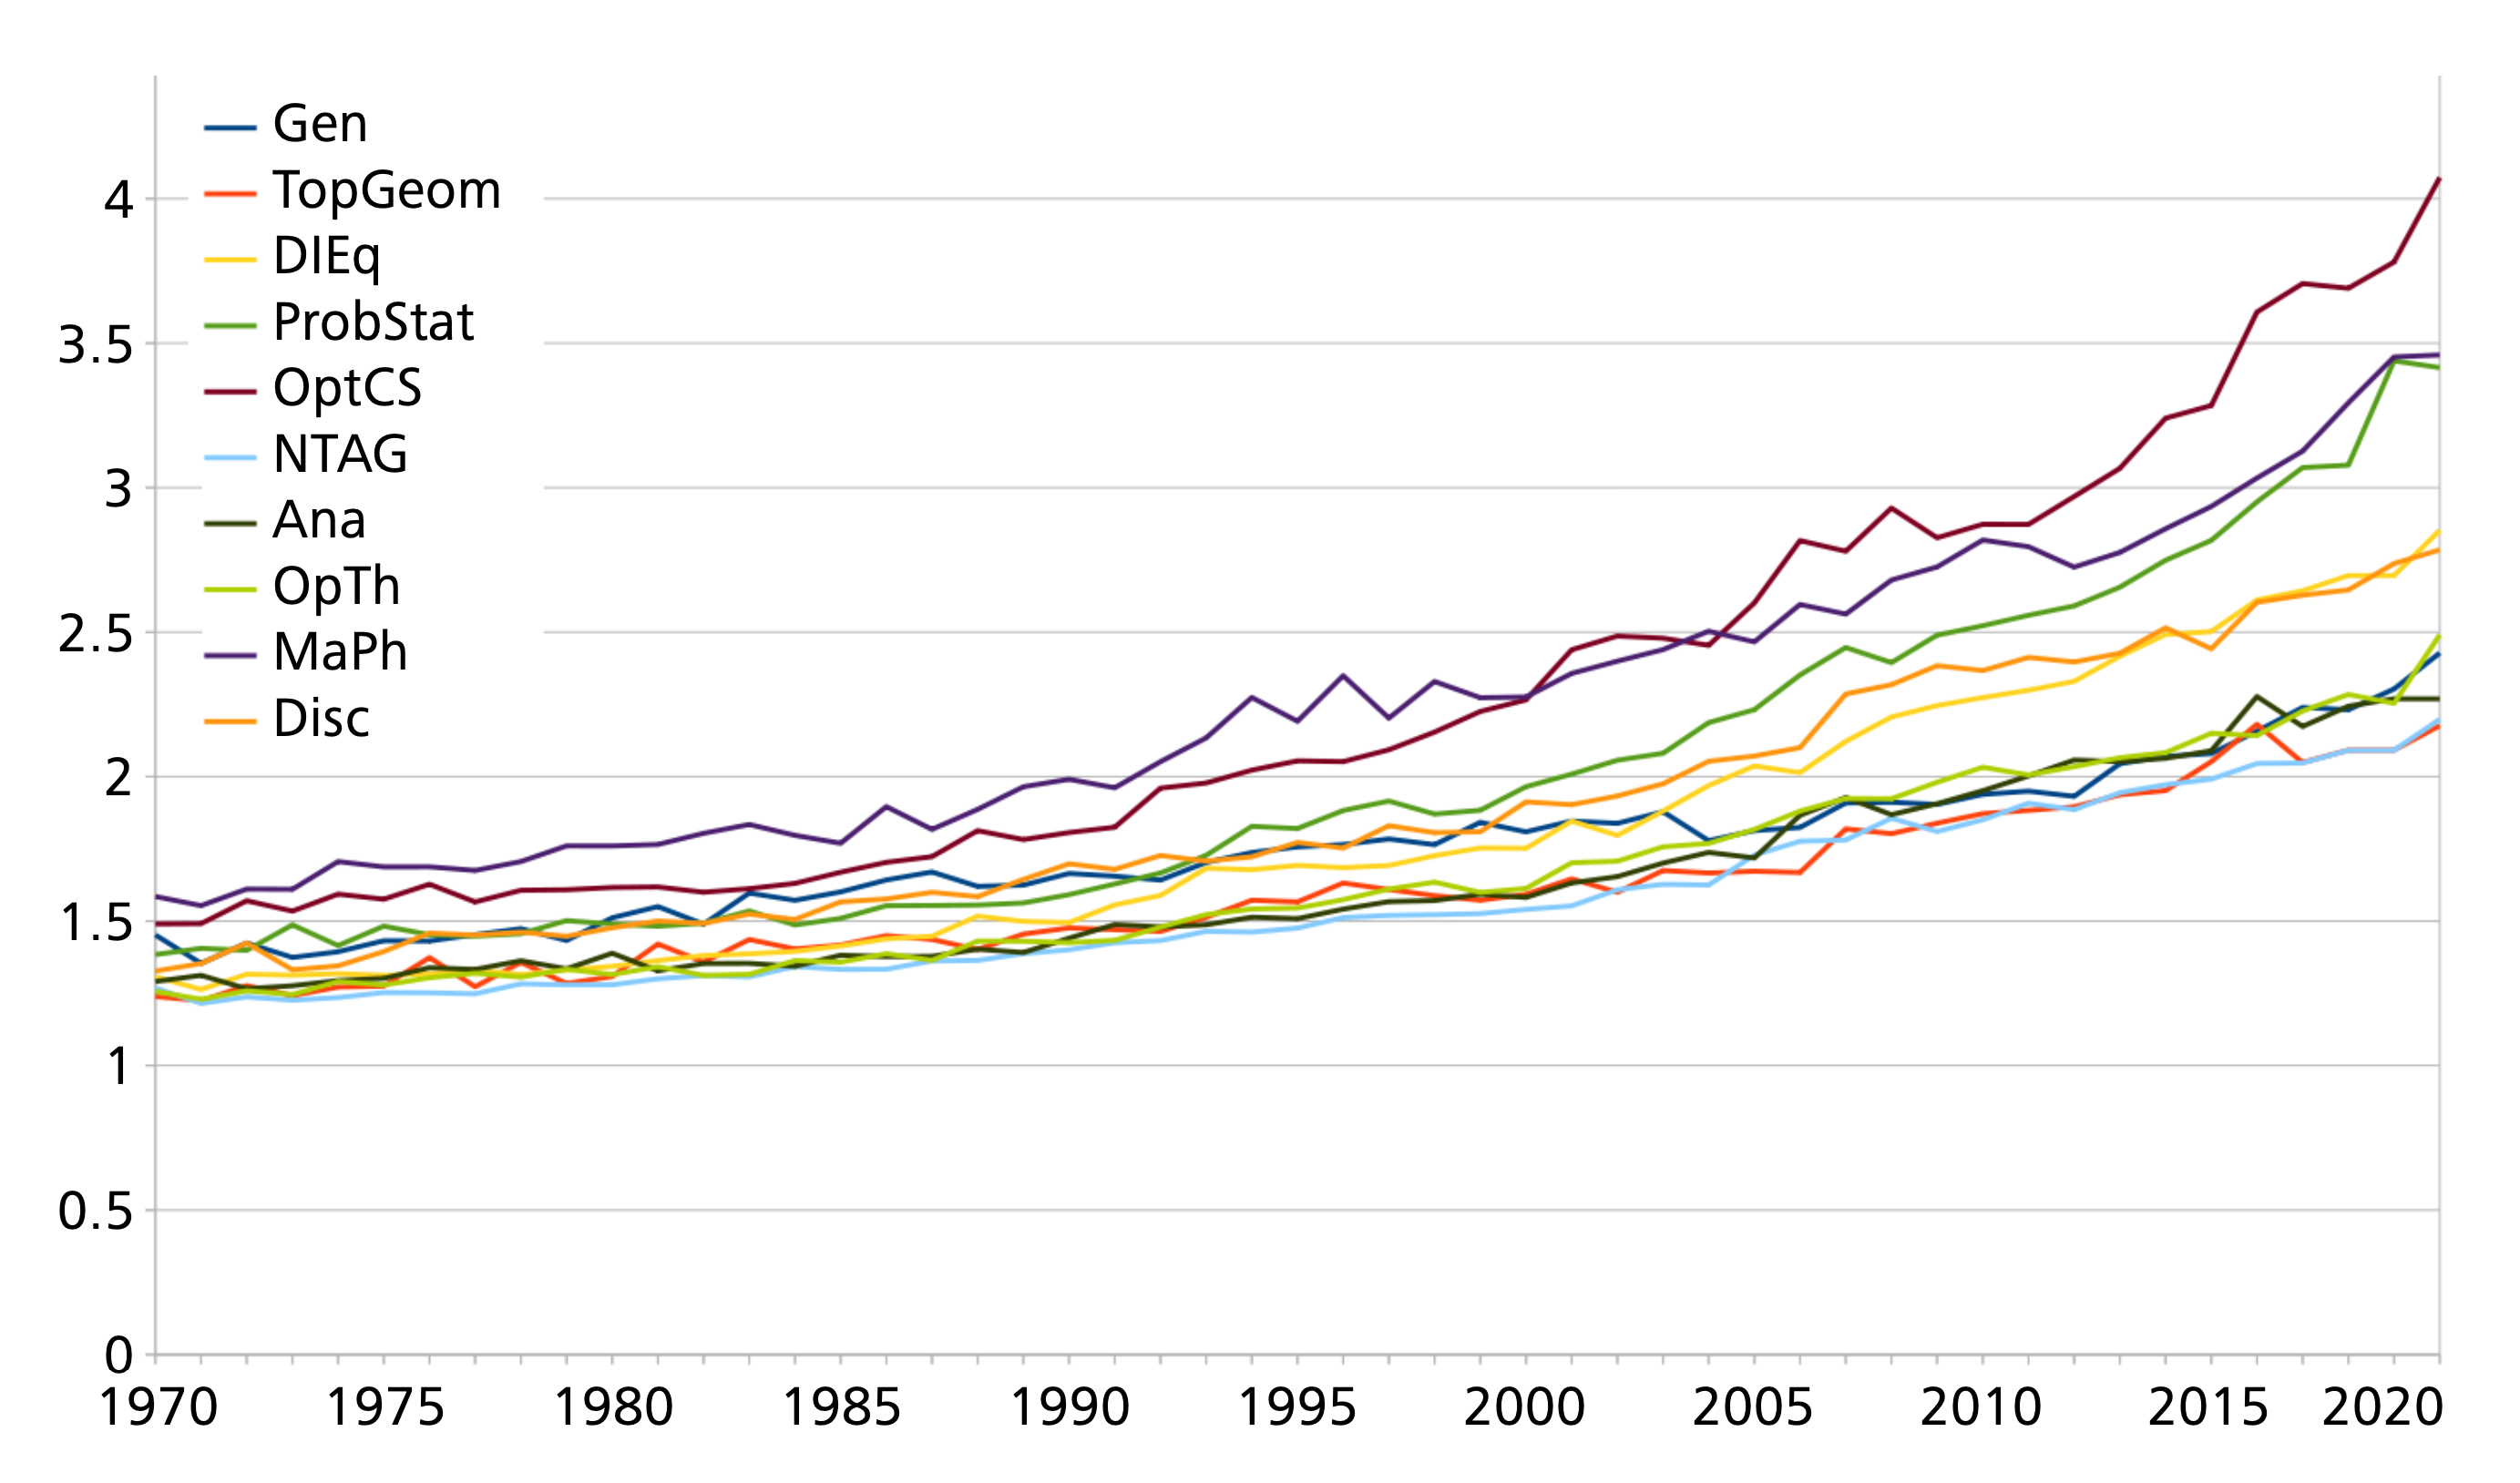
The mathematics collaboration graph has been investigated frequently, especially in [8 M. Jost, N. D. Roy and O. Teschke, Another update on the collaboration graph. Eur. Math. Soc. Newsl. 100, 58–60 (2016) ], based on zbMATH Open data. While the median distance in its large connected component is 5, the situation is different when one looks at the collaboration distance for a citation. Here one would naturally expect shorter collaboration distances. Since higher collaboration distances are linked to a higher error probability, we restrict our discussion to the ranges from 0 (self-citations), 1 (coauthor citations), 2, 3 and more than 3. The distribution shown in the following diagram indicates that these seem indeed the most significant categories.
More precisely, we computed for each authorship in a paper cited in zbMATH Open the minimal collaboration distance to the citing paper (note that due to multiple authorships, the total number is larger than the overall number of matched references in the database). The figures show that both the average and the median collaboration distance are equal to 3. The aggregation for authors, however, seems to indicate that the distribution is somewhat uneven, see Figure 9.

Of the 671,513 cited authors evaluated, most (271,435) have median collaboration distance for their citations, with a second maximum at distance 2. When we restrict this analysis to the top 15,000 cited authors in zbMATH Open (which account for more than half of all citations), the picture is, however, different:

One sees that the distribution in Figure 9 derives from the large number of rarely cited (and thus presumably also rarely collaborating) authors, which therefore necessarily also have larger collaboration distances. For the 100 authors with most citations in zbMATH Open, the picture is even more clear, see Figure 11.

In the presence of a high number of citations, a median of 3 for the collaboration distance of citations seems indeed to be the default value, which is very much the standard for today’s mathematical community. The larger value of 4 occurs almost exclusively for older mathematicians with fewer collaborations (e.g., Kolmogorov, Mac Lane, or Pólya), or in bordering areas for which collaboration paths may exist only outside the database (e.g., Barabási or Hawking). On the other hand, Erdős, who is obviously at a disadvantage due to his huge collaboration network, is almost the only elder famous mathematician with median 2; else, median 2 occurs mostly for younger mathematicians where the citations are more likely to derive from a narrower community. Especially, the rare cases of median 1 (i.e., most citations are self-citations or come from immediate coauthors) indicate almost invariably a very particular citation network.
Finally, we compare the collaboration distance (CD) distribution of zbMATH Open citations for the Fields Medalists (FM) and the highly-cited researchers (HCR) in mathematics in 2022 of the Clarivate1Clarivate Highly Cited Researchers in mathematics 2022, https://clarivate.com/highly-cited-researchers/?clv-category=Mathematics (accessed 11 August 2023) database:
| CD | 0 | 1 | 2 | 3 | 3 |
| FM | 7,129 | 37,576 | 117,667 | 193,372 | 130,562 |
| HCR | 29,893 | 139,980 | 164,290 | 175,220 | 81,515 |
The huge difference between the distribution in both series is obvious. Although the Clarivate HCR gather a much larger total citation number, only a relative small fraction affects collaboration distances , which usually accounts for most of the citations. By far most of HCR citations derive from the close coauthor network, and the median of 2 differs significantly from the corresponding figure of the most cited authors in zbMATH Open. Even as much as 10% of Clarivate HCR turn out to have an extreme collaboration median of 1 for their zbMATH Open citations, i.e., most of their citations are self- or coauthor citations. The difference of median citation distance for Clarivate HCR in comparison to highest cited zbMATH Open authors may indicate that the Clarivate database contains many more sources that involve large numbers of self- and coauthor citations. This adds evidence to the observation in [6 E. Dunne, Don’t count on it. Notices Amer. Math. Soc. 68, 114–118 (2021) ] that citations for Clarivate HCR contain a significantly higher number of self-citations. Indeed, the difference exists not just at level zero, it actually becomes even more significant in the full distribution of citations with respect to the collaboration distance.
This indicates that the distribution of citations with respect to the collaboration distance provides a more meaningful impression of the “impact” reflected by citations. However, since it obviously depends heavily on both the age of the author and the size of the areas, it appears not advisable to derive yet another bibliometric measure from it. Rather, the distribution should be taken into account along with other information (such as age or subject specifics), to better understand what is usually hidden in total citation figures.
zbMATH Open bibliographic data used in this column are available under a CC-BY-SA license at the zbMATH Open OAI-PMH API, see [12 M. Schubotz and O. Teschke, zbMATH Open: Towards standardized machine interfaces to expose bibliographic metadata. Eur. Math. Soc. Mag. 119, 50–53 (2021) ]. The data used in this analysis reflect the status of the database as of June 30th, 2023.2The data are available at https://doi.org/10.5281/zenodo.8234415
Acknowledgements. We would like to thank Michael Jost (FIZ Karlsruhe) for implementing the algorithm generating the citation data for various collaboration distances.
- 1
Clarivate Highly Cited Researchers in mathematics 2022, https://clarivate.com/highly-cited-researchers/?clv-category=Mathematics (accessed 11 August 2023)
- 2
The data are available at https://doi.org/10.5281/zenodo.8234415
References
- A. Bannister, K. Hulek and O. Teschke, Das Zitationsverhalten in mathematischen Arbeiten: Einige Anmerkungen. Mitt. Dtsch. Math.-Ver. 25, 208–214 (2017)
- A. Bannister and O. Teschke, An update on time lag in mathematical references, preprint relevance, and subject specifics. Eur. Math. Soc. Newsl. 106, 41–43 (2017)
- T. Bouche, O. Teschke and K. Wojciechowski, Time lag in mathematical references. Eur. Math. Soc. Newsl. 86, 54–55 (2012)
- M. Bras-Amorós, J. Domingo-Ferrer and V. Torra, A bibliometric index based on the collaboration distance between cited and citing authors. J. Informetrics 5, 248–264 (2011)
- E. Dunne, Are math papers getting longer? Web blog post in Beyond Reviews: Inside MathSciNet, American Mathematical Society (14 October 2021) https://blogs.ams.org/beyondreviews/2021/10/14/are-math-papers-getting-longer/
- E. Dunne, Don’t count on it. Notices Amer. Math. Soc. 68, 114–118 (2021)
- K. Hulek and O. Teschke, The transition of zbMATH towards an open information platform for mathematics. Eur. Math. Soc. Newsl. 116, 44–47 (2020)
- M. Jost, N. D. Roy and O. Teschke, Another update on the collaboration graph. Eur. Math. Soc. Newsl. 100, 58–60 (2016)
- H. Mihaljević-Brandt and N. Roy, zbMATH author profiles: open up for user participation. Eur. Math. Soc. Newsl. 93, 53–55 (2014)
- H. Mihaljević-Brandt and O. Teschke, Journal profiles and beyond: What makes a mathematics journal “general”? Eur. Math. Soc. Newsl. 91, 55–56 (2014)
- N. Schappacher, Framing global mathematics: The International Mathematical Union between theorems and politics. Springer, Cham (2022)
- M. Schubotz and O. Teschke, zbMATH Open: Towards standardized machine interfaces to expose bibliographic metadata. Eur. Math. Soc. Mag. 119, 50–53 (2021)
- O. Teschke and B. Wegner, Author profiles at Zentralblatt MATH. Eur. Math. Soc. Newsl. 79, 43–44 (2011)
- O. Teschke, Green, gold, platinum, nickel: On the status of open access in mathematics. Eur. Math. Soc. Newsl. 110, 60–63 (2018)
- O. Teschke, The “Jahrbuch über die Fortschritte der Mathematik” as a part of zbMATH Open. Eur. Math. Soc. Mag. 122, 62–64 (2021)
Cite this article
Klaus Hulek, Olaf Teschke, How do mathematicians publish? – Some trends. Eur. Math. Soc. Mag. 129 (2023), pp. 36–41
DOI 10.4171/MAG/160