Introduction
As a contribution to some aspects of the gender gap in mathematics, this paper provides a detailed analysis of mathematicians’ answers to the Global Survey of Scientists [6 R. Ivie and S. White, Measuring and analyzing the gender gap in science through the global survey of scientists. In [5], pp. 39–81. ]. The questions we address are the following: are the answers from all sciences and the answers of mathematics or applied mathematics similar? In which cases is the situation in mathematics or in applied mathematics different from the situation in all sciences? Better or worse?
The Global Survey of Scientists [6 R. Ivie and S. White, Measuring and analyzing the gender gap in science through the global survey of scientists. In [5], pp. 39–81. ], a survey of scientists from every continent, was launched to assess and understand the gender gap in science as part of the project “A Global Approach to the Gender Gap in Mathematical, Computing, and Natural Sciences: How to Measure It, How to Reduce It?”, in short “Gender Gap in Science”, funded primarily by the International Science Council from 2017 to 2019.1https://gender-gap-in-science.org/ The Global Survey of Scientists assesses female and male scientists’ experiences throughout their careers. More precisely, the survey reveals how scientists perceived their education, university studies, doctoral studies, career, the balance of their work and family life, and whether they experienced discrimination or sexual harassment.
The Global Survey of Scientists was distributed in Arabic, Chinese, English, French, Japanese, Russian, and Spanish. More than 30,000 people, half of them men and half women, responded to the questionnaire, mainly from the disciplines involved in the project: mathematics including applied mathematics, computer science, biology, chemistry, physics, astronomy, history and philosophy of science.
Overall, the survey findings confirm the existence of a significant gender gap in the scientific community. In all areas explored by this survey, women’s experience is consistently less positive than that of men.
It is important to highlight the methodology used to collect the data. As there is no single network or resource for contacting all students and professional scientists worldwide, a snowball sampling method was used to tap into as many personal networks as possible. The contact databases of the project’s partner organisations were used to reach students and professional scientists worldwide, asking them to complete the survey and invite their contacts to respond. Snowball sampling does not produce a statistically representative sample. For example, women account for around 30% of scientists worldwide [13 UNESCO Institute for Statistics, Women in Science. Fact Sheet No. 55, FS/2019/SCI/55 (2019) https://uis.unesco.org/sites/default/files/documents/fs55-women-in-science-2019-en.pdf (retrieved 17 July 2023) ], but 50% of survey responses came from women. Consequently, our findings only indicate trends among those who responded to the survey, not the overall population of scientists. However, the consistency of the results across disciplines, geographical areas and levels of development is reassuring.
Following the completion of the Global Survey of Scientists and the publication of its results, it was decided to further exploit the data concerning mathematicians’ responses to the survey and compare them to the responses from all sciences. Our aim was to see if there were differences between mathematicians and other scientists in terms of the gender gap. The answers of the 3,458 mathematicians (among them 2,146 applied mathematicians) who responded to the survey were then analysed and compared to the 30,037 answers to the questionnaire. In an internship funded by the IMU and ICIAM, Cecilia A. Rivera Martinez [12 C. A. Rivera Martinez, Gender gap in science: Mathematics, applied mathematics, and Africa. Rapport de stage de Master 2 Statistique et Science de Données, CNAM, Paris (2021) ] started a statistical analysis of the corresponding data using a methodology based on a multivariate analysis to discard results due to confounding variables, as explained in the Appendix. Further work was then carried out to refine and interpret her results and visualize them.
Our analysis confirms the existence of a significant gender gap in the mathematical community: in all areas explored by the Global Survey of Scientists, women mathematicians’ experience is consistently less positive than that of men mathematicians. In most cases, the answers from all sciences and the answers from mathematics or applied mathematics are in fact very similar. However, in a few cases, it is possible to see that the situation in mathematics or in applied mathematics is different from the situation in all sciences, sometimes better, sometimes worse.
The paper is organised as follows. First, we examine the results of the survey in mathematics and applied mathematics. We then give some additional information about the Gender Gap in Science project and its results, in addition to the Global Survey of Scientists. We end with a conclusion.
1 The results of the Global Survey of Scientists in mathematics and applied mathematics
The questionnaire covered nine main themes: a total of 30,037 persons responded worldwide, half women and half men, mainly from disciplines involved in the project, say mathematics, including applied mathematics, computer science, biology, chemistry, physics, astronomy, history and philosophy of science. In that survey, the questions were broadly organised around nine themes: (1) secondary degree; (2) first university degree; (3) master and doctoral degree; (4) employment; (5) grants, publications, and related topics; (6) interruptions in studies and career; (7) marriage, partnership, and parenthood; (8) discouragement and discrimination (9) sexual harassment.2See the list of questions (in English) here: http://bit.ly/GSSQuestionList.
Data collected
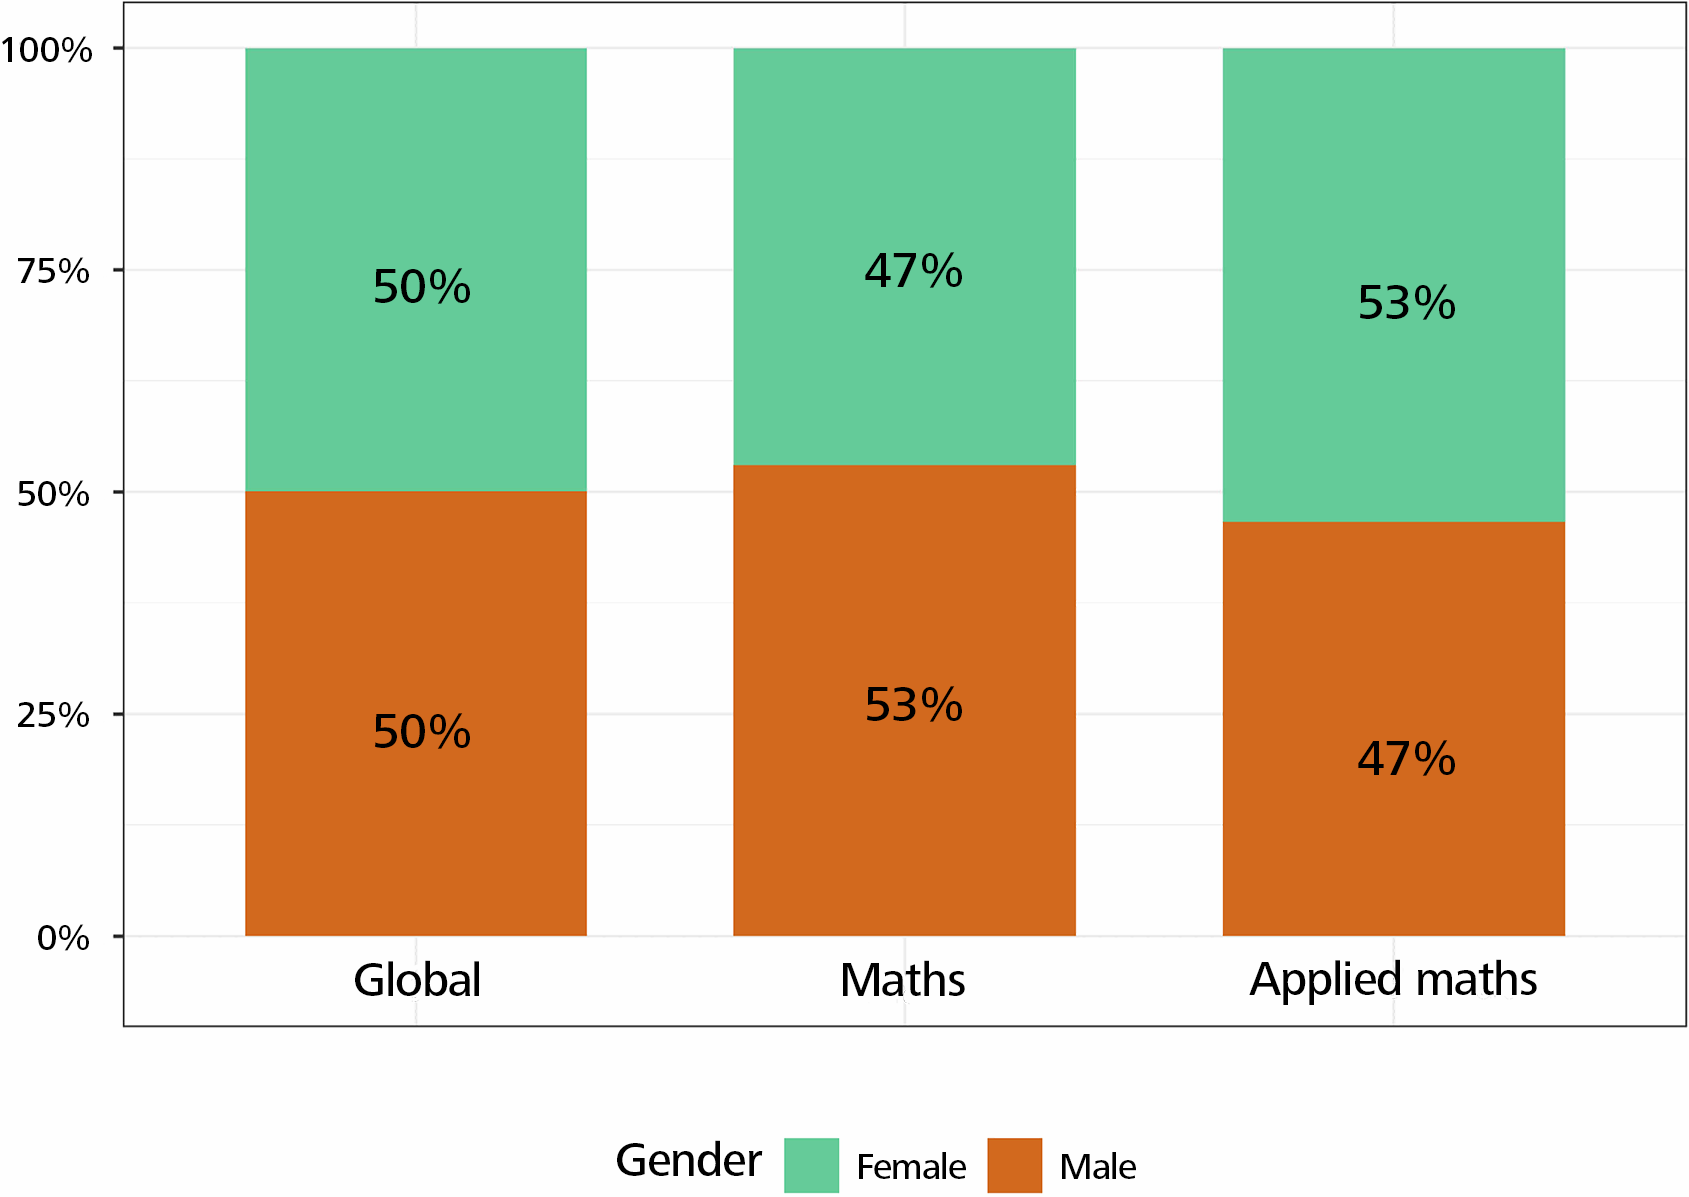
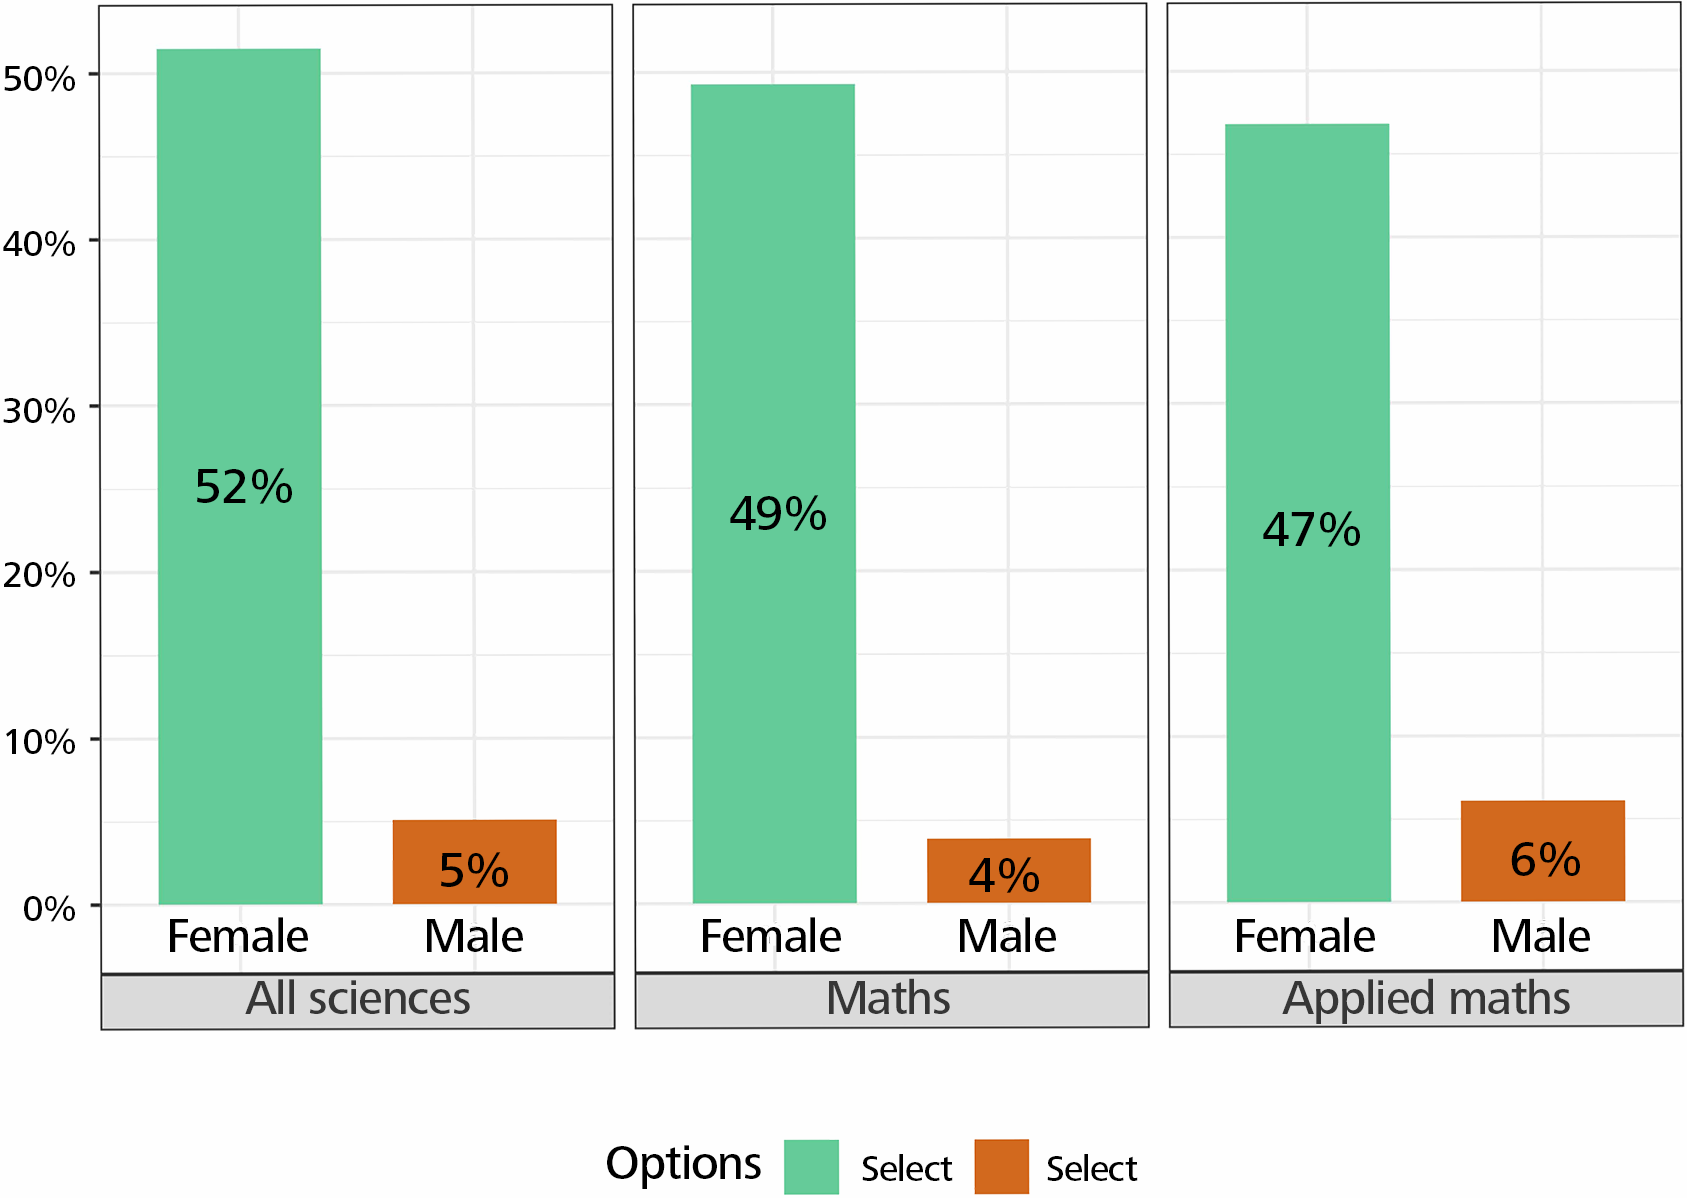
We analyse the answers of the 3,458 mathematicians (among them 2,146 applied mathematicians) who responded to the survey and compare them to the answers from all sciences. In terms of gender distribution, we note a higher percentage of men in mathematics than in all sciences, and a higher percentage of women in applied mathematics than in all sciences (Figure 1).
We decided to organise the results in four chapters: Studies, Work, Balance of work and family life, and Difficulties.
All the statements in this text that are not illustrated by figures can be viewed on the website indicated above.4https://gender-gap-in-science.org/mathvisualisation/ It is important to note that in all the results we present to illustrate a difference between the answers of women and men, our multivariate analysis confirmed that the difference is not due to confounding variables such as age, employment sector, geographical region or HDI (Human Development Index) of the country.
Studies
To the question “Who most encouraged you in your studies?”, the percentage of answers “your own determination, will power and hard work” is very high, and even more so for women. Similarly, parental support is very important for women. Support from teachers is also significant, and more important in mathematics than in all sciences. Teachers appear to support men more than women in applied mathematics. On the other end, there is no difference between women and men when it comes to support from teachers, professors or mentors in all sciences and mathematics (Figure 2).
Spouse or partner support is more important for women than for men. Support from other students or from the neighbourhood, community and friends is significantly less important for women, especially in mathematics! (Figure 3.)
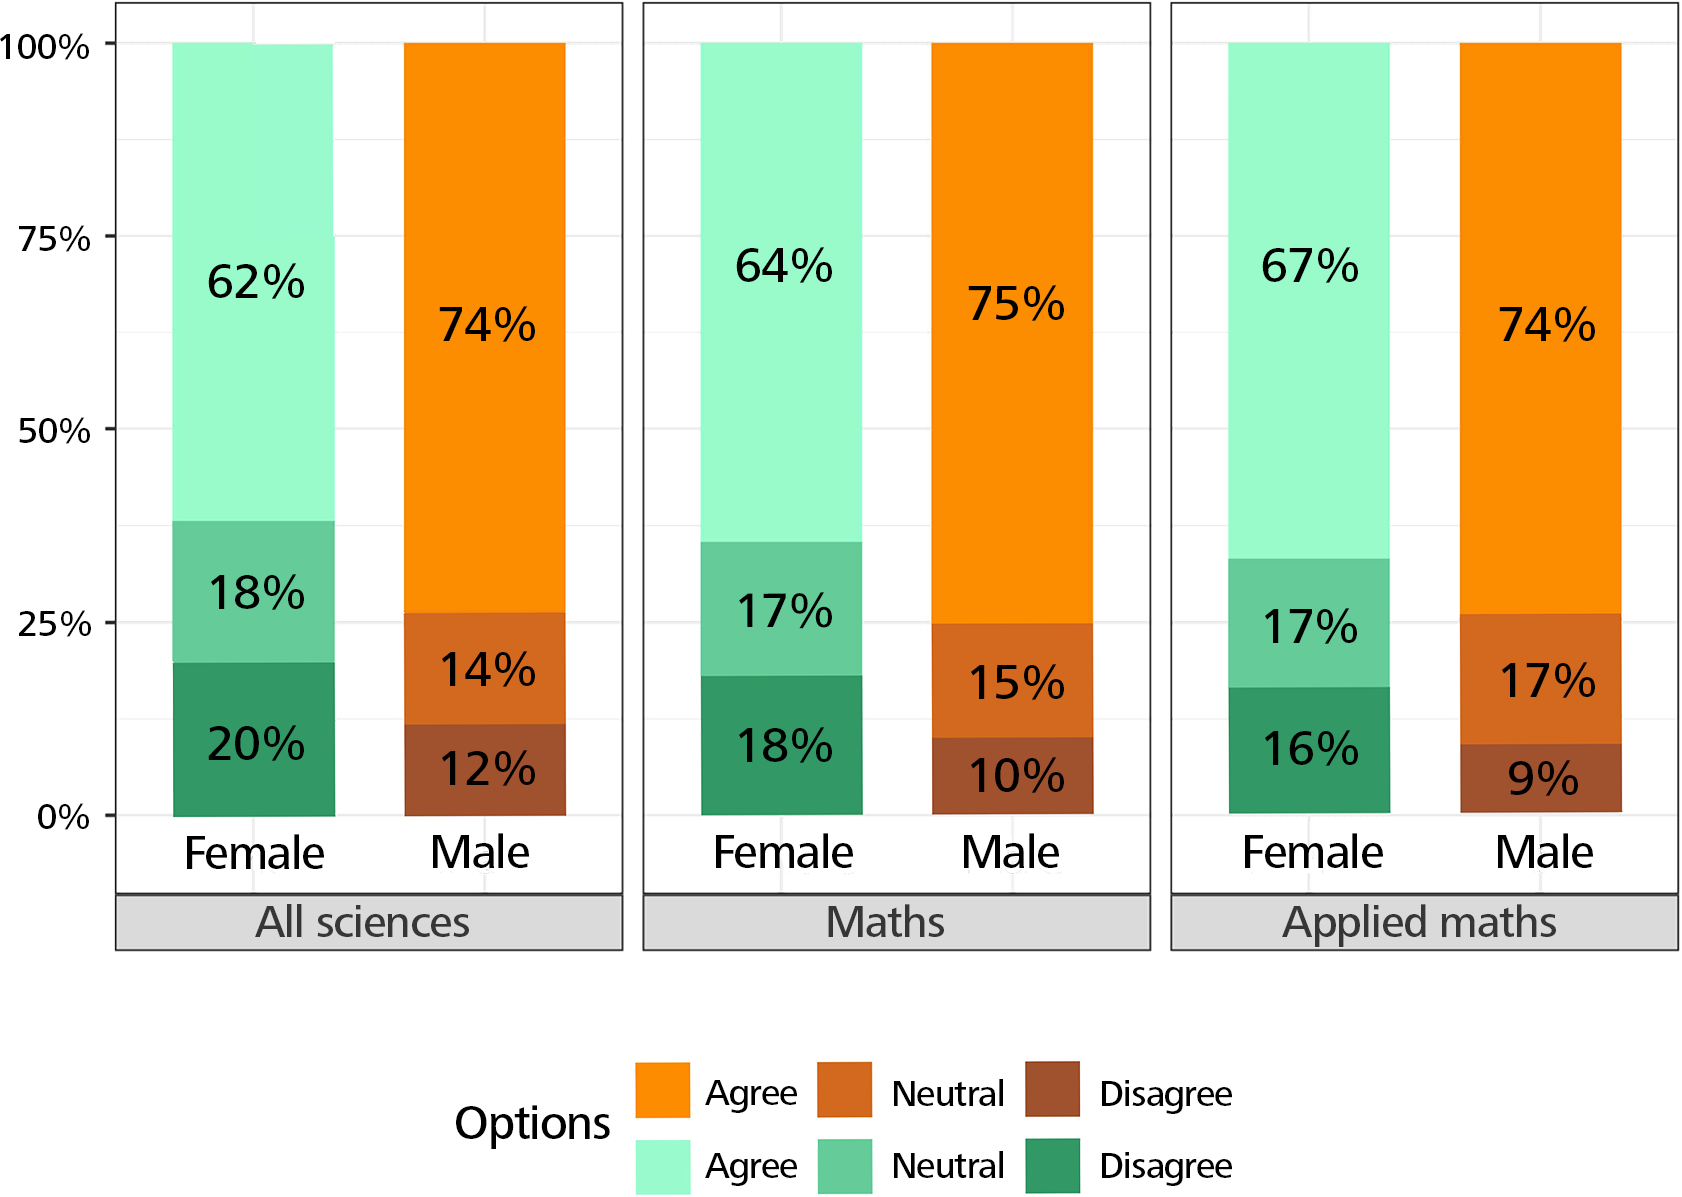
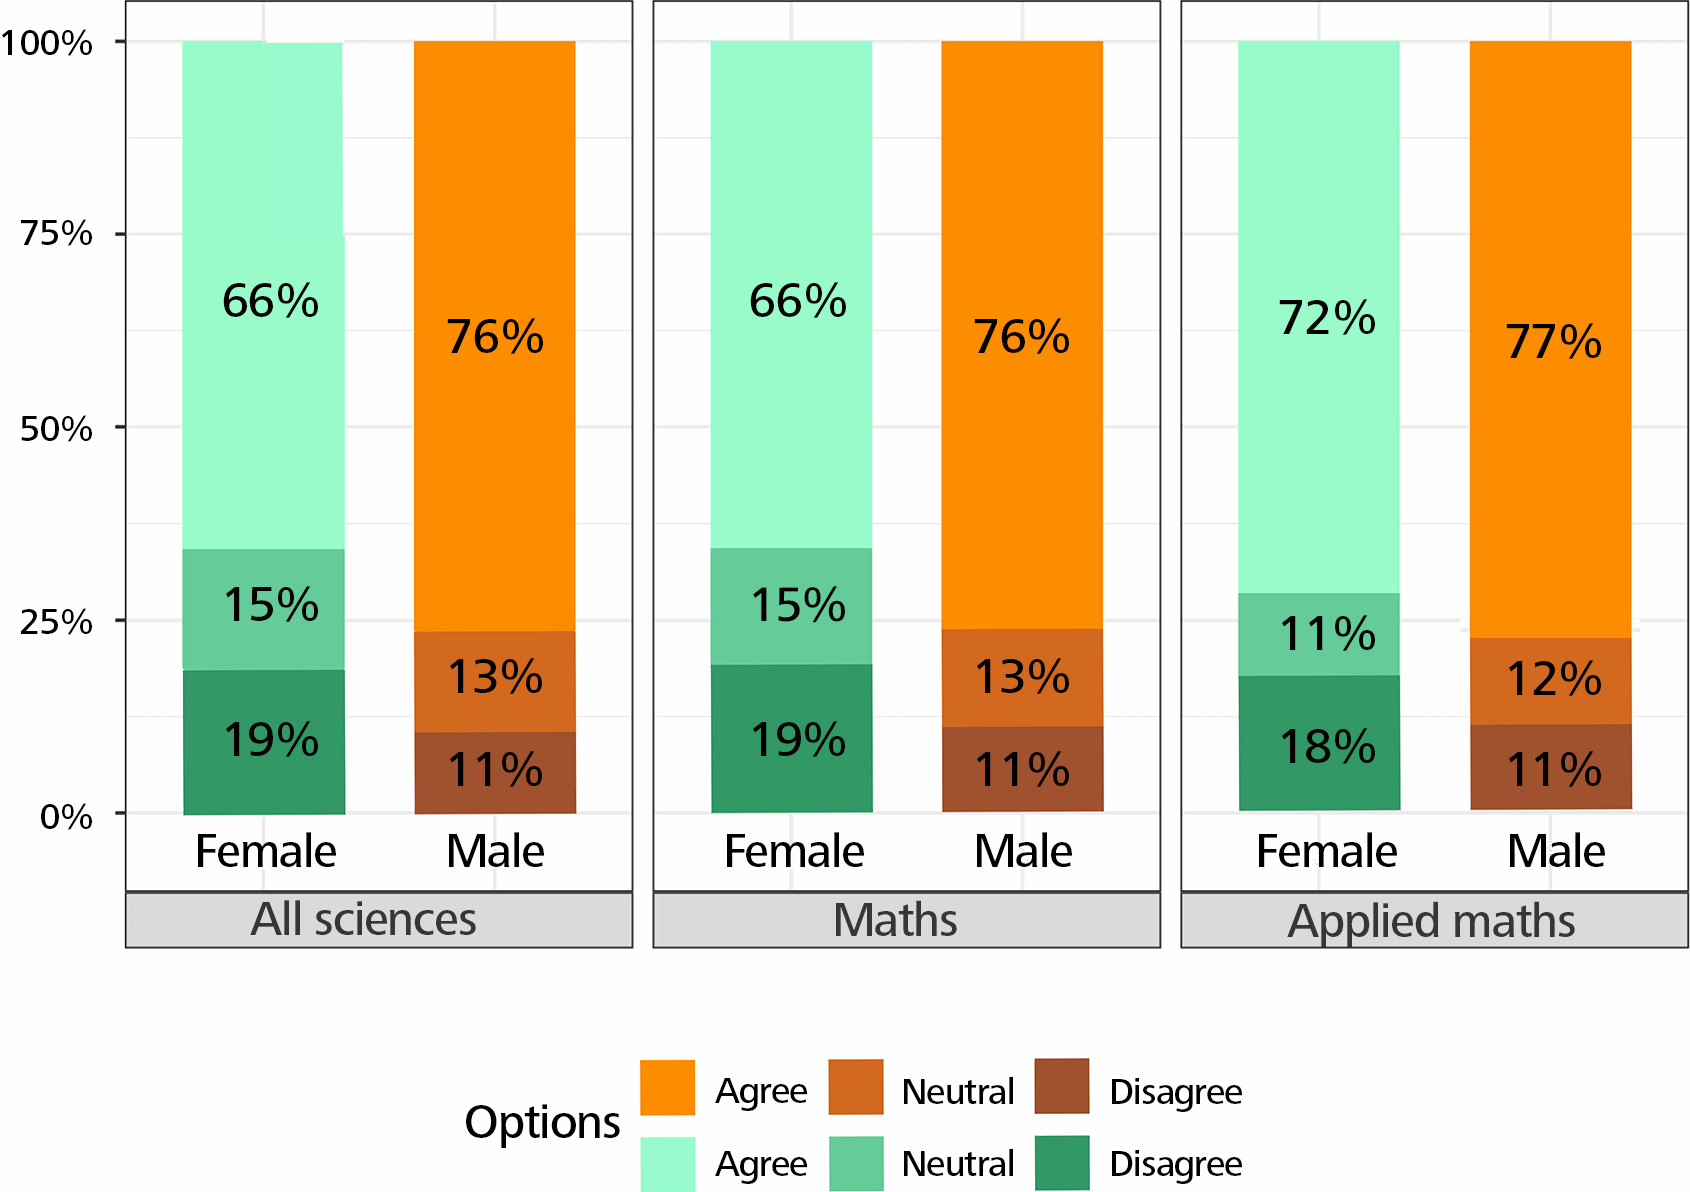
To the question “How do you rate your overall experience in your doctoral program?” the answers were very positive regarding the curriculum and the quality of the program, especially in mathematics, and with no difference between women and men. The relationship with the advisor is very positive in mathematics compared to all sciences, but less positive for women than for men. For the questions “My program treated everyone fairly” and “Other students were respectful of everyone” more women disagreed. However, the answers of women are slightly more positive in mathematics than in all sciences (Figure 4).
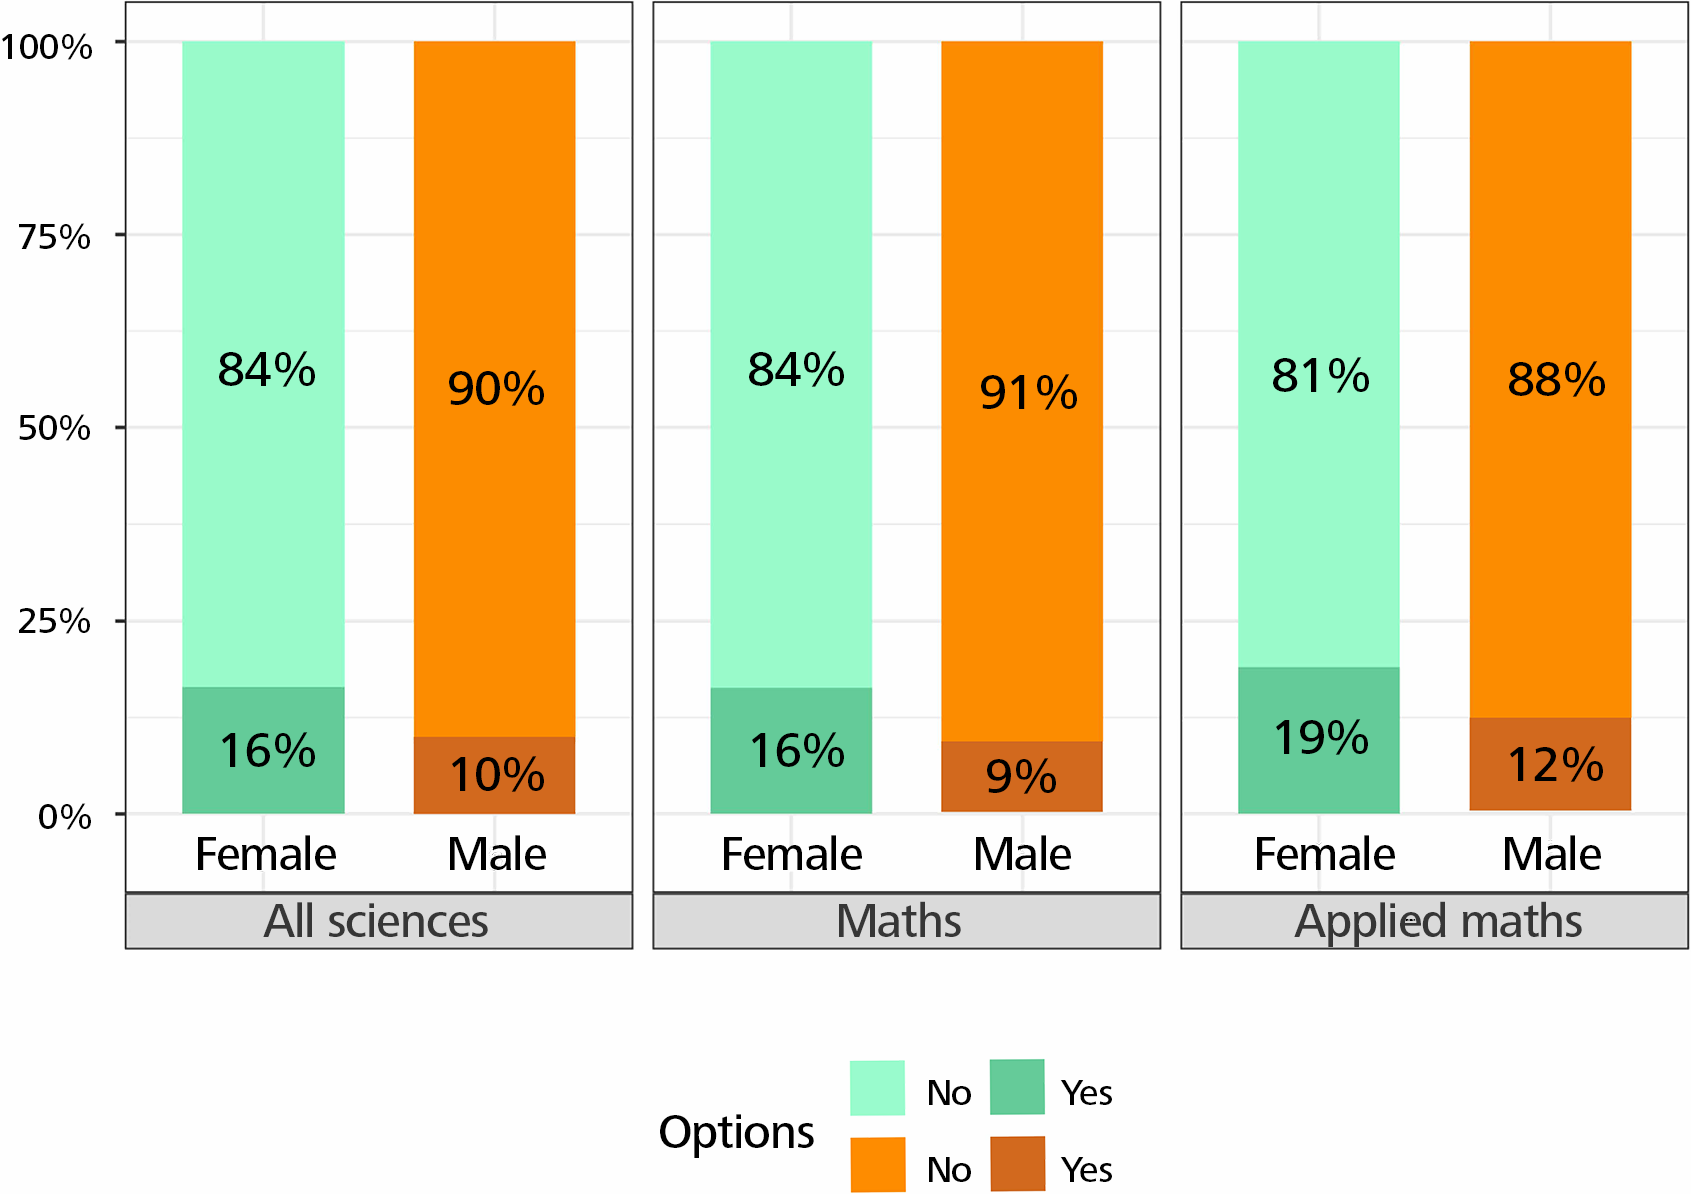
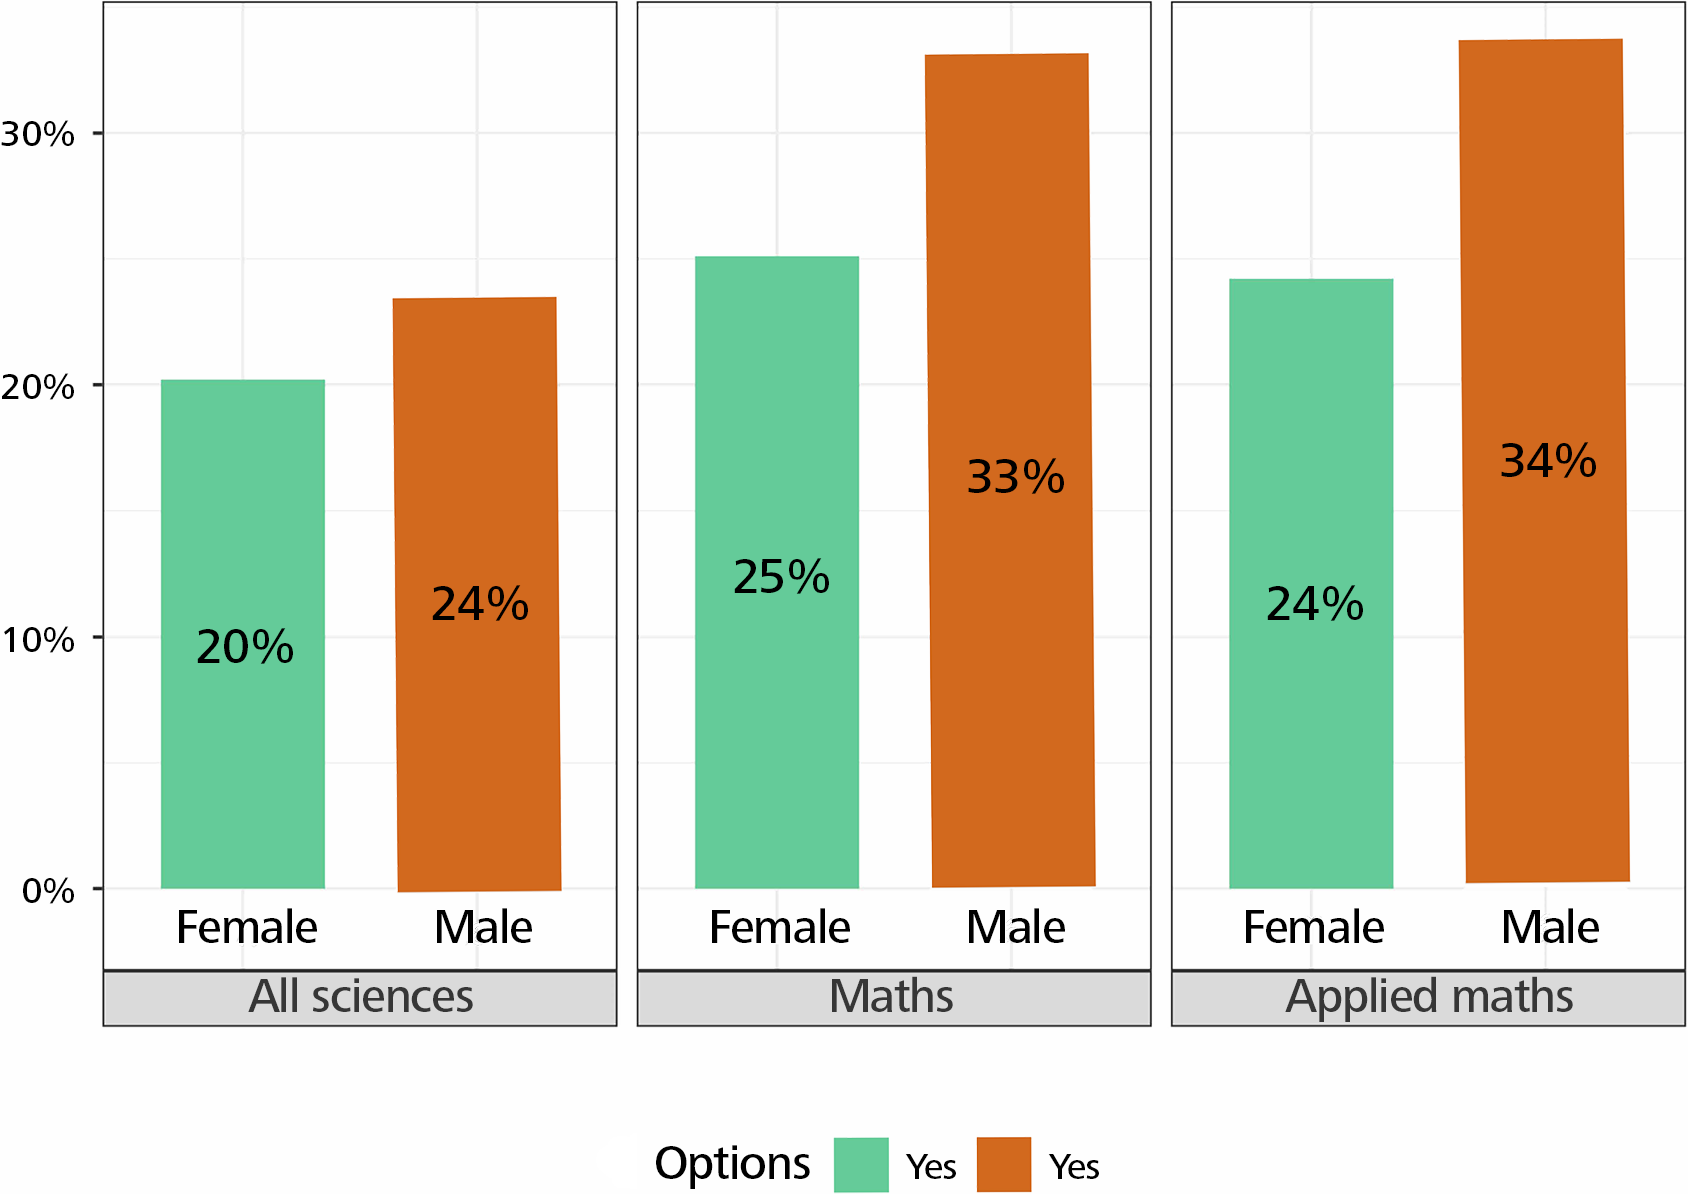
There is a significant difference between women and men’s answers to the question “Was your primary advisor/supervisor a woman or a man?”. There are few women advisors, especially in mathematics. However, more women than men have female advisors.
In response to the question “During your doctoral studies, did you have enough of the following to conduct or present your research?”, a large majority are satisfied with the funding, but the percentage of women satisfied is lower. The same applies to similar questions (office space, laboratory space, equipment, travel expenses, administrative support, IT capacity, technical support, access to data, access to scientific literature). When it comes to support for working parents, women are significantly less satisfied, but the difference between women and men is smaller in mathematics.
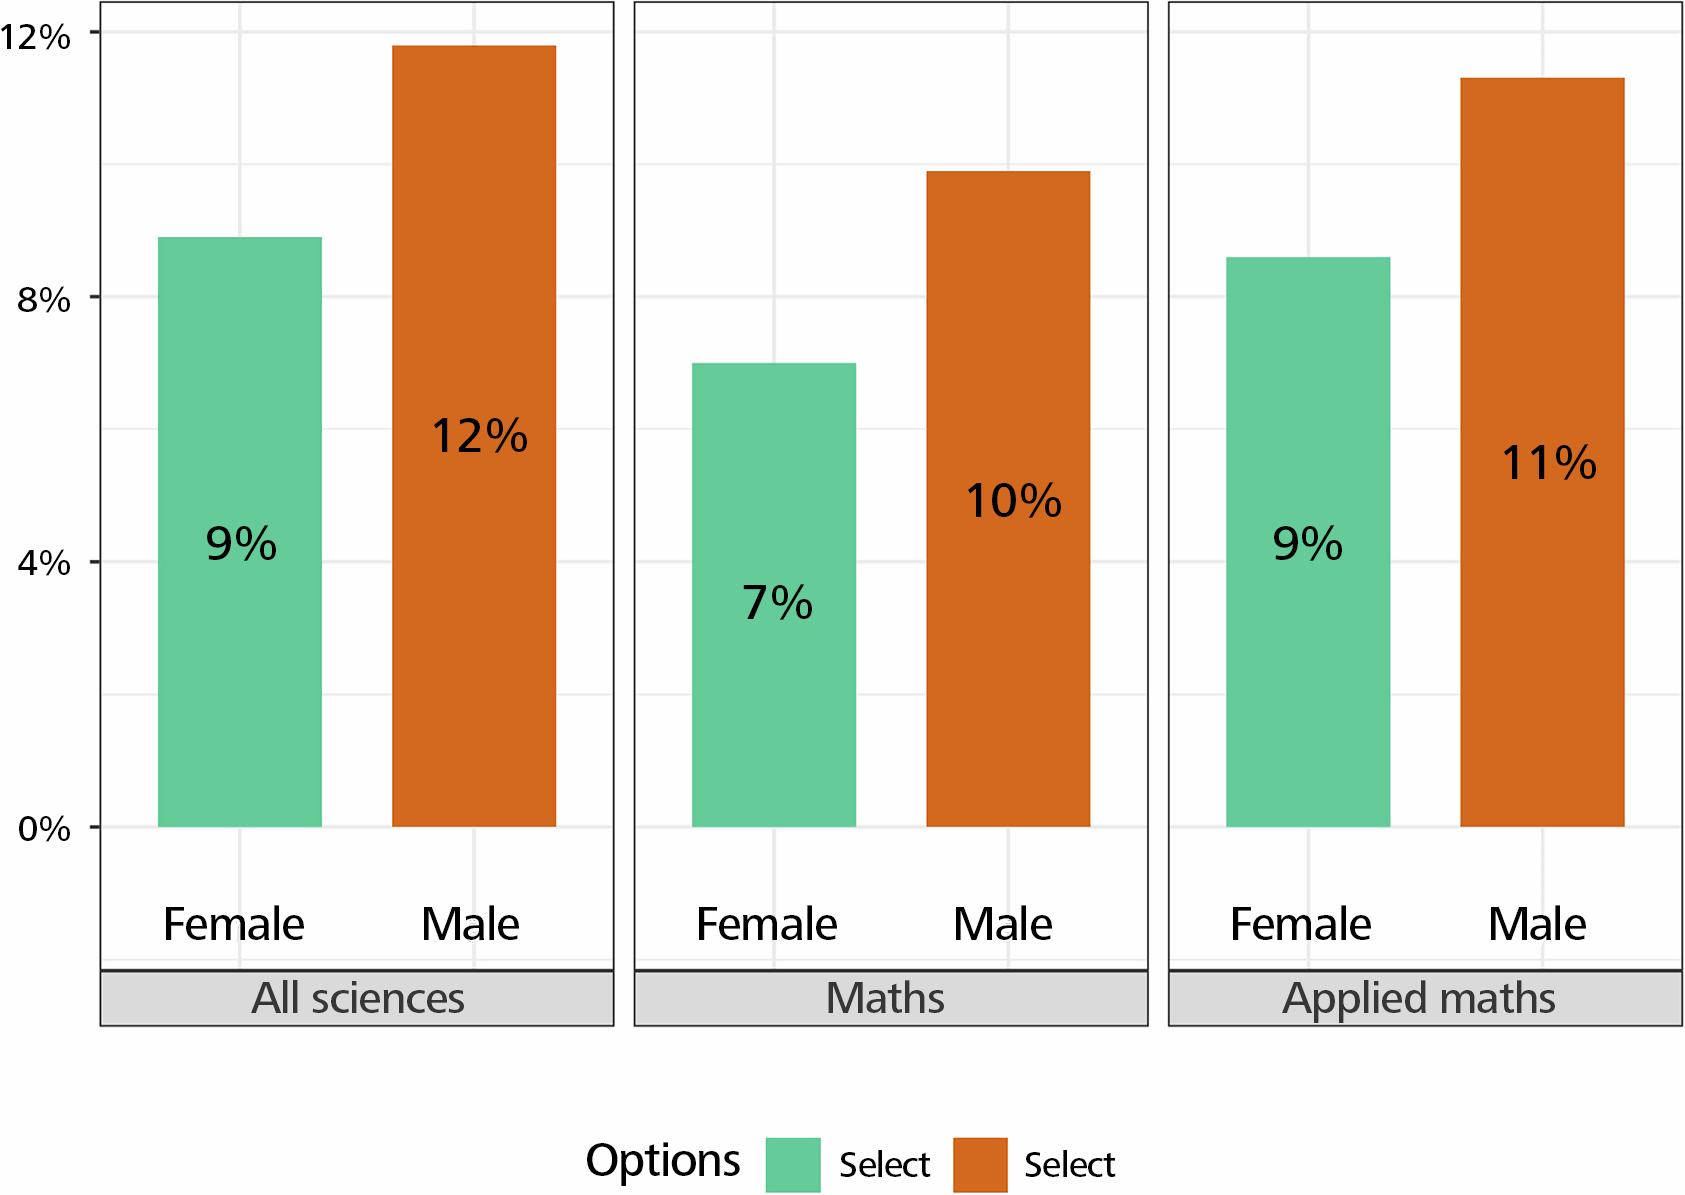
When it comes to the answers to the question “What were the primary sources of financial support during your doctoral studies?” in mathematics, the percentage of women answering “yes” for fellowship, scholarship, or grant, is lower than that of men. In mathematics, the percentage of women answering “yes” is higher than that of men for teaching or research assistantships, in contrast to the situation in all sciences. The percentage of “yes” answers is higher for men when it comes to government income or support from parents or family, and lower overall in mathematics (Figure 5).
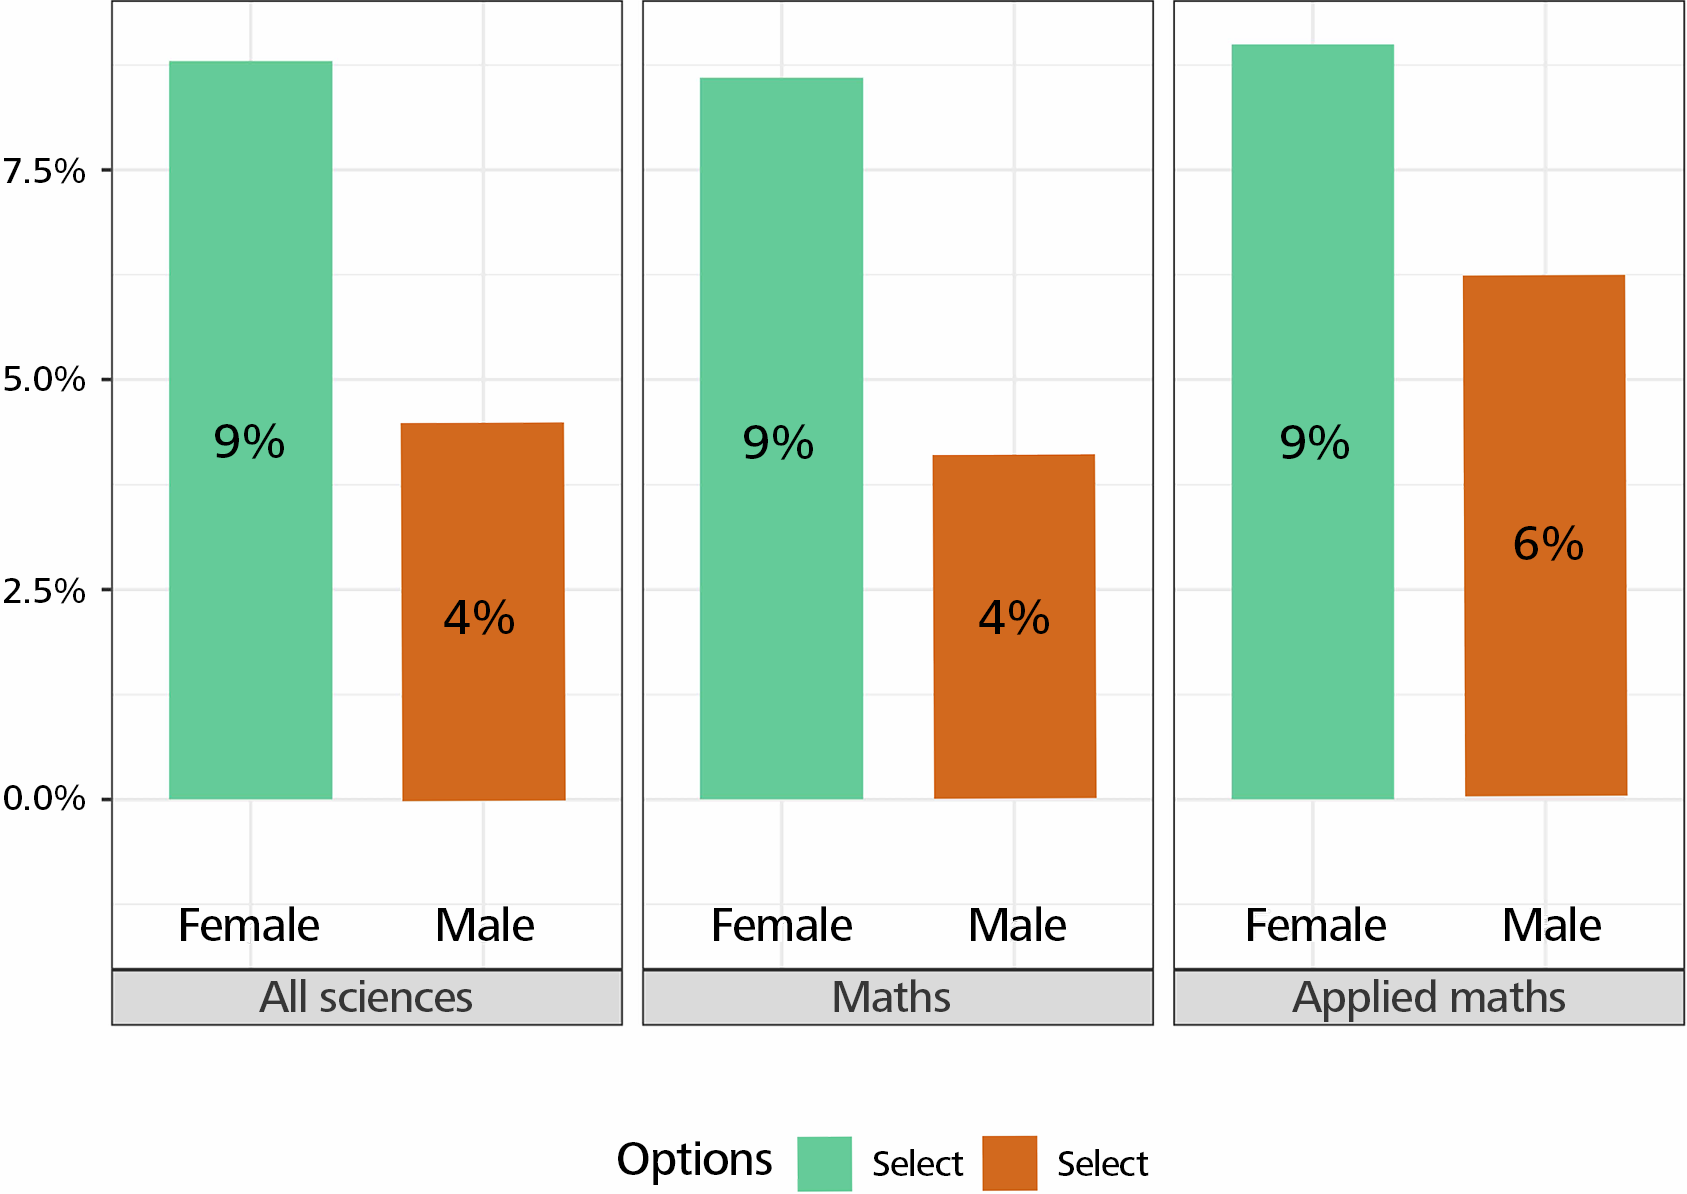
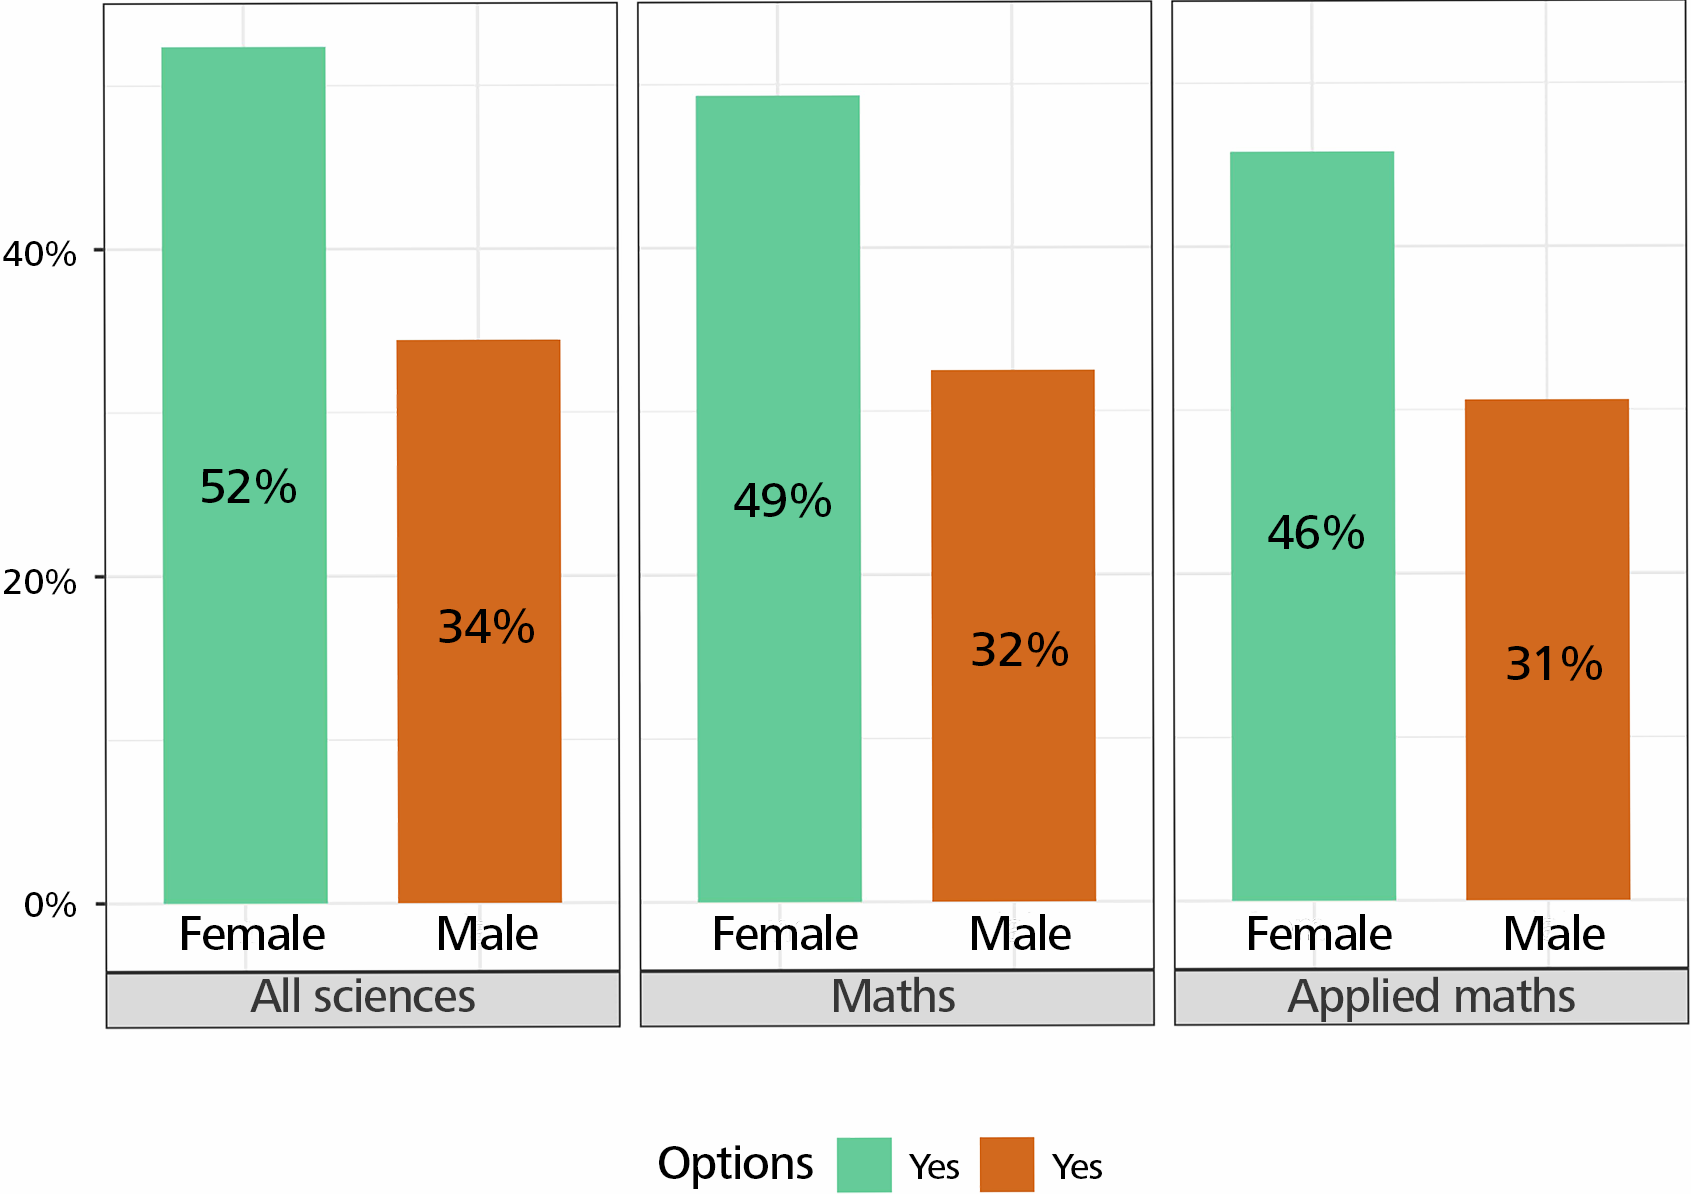
The percentage of “yes” answers is higher among women when it comes to personal savings or support from a spouse or partner (Figure 6).
Women are more likely to interrupt their doctoral studies (Figure 7). The reasons for interruption, for which the percentage of women is higher, are pregnancy and/or child-rearing, but also family obligations or change of family situation, change of residence due to partner harassment or discrimination. Not surprisingly, harassment or discrimination is mainly experienced by women, but less so in mathematics or applied mathematics.
The reasons for interruption, for which the percentage of men is higher, are military service, but also change of field of study, difficulties with the university or supervisor/advisor, or financial constraints.
Work
More women than men disagree with the following statements: “My employer treats everyone fairly”, “My co-workers are respectful of everyone” (Figure 8), “I have support from my primary manager or boss.”
When it comes to sufficient resources for research, women are consistently less satisfied than men, particularly in terms of funding, travel money and support for working parents.
It is harder for women to find jobs, progress in their careers and be well paid, compared to other colleagues with similar qualifications. Women have fewer opportunities than men to give a talk, attend a conference abroad, conduct research abroad, and to act as a boss or manager.
Opportunities to advise or supervise post-graduate students, to serve on a thesis or dissertation committees (not as advisor or supervisor) or to serve on an organising committee are lower for women than for men, particularly in the field of mathematics.
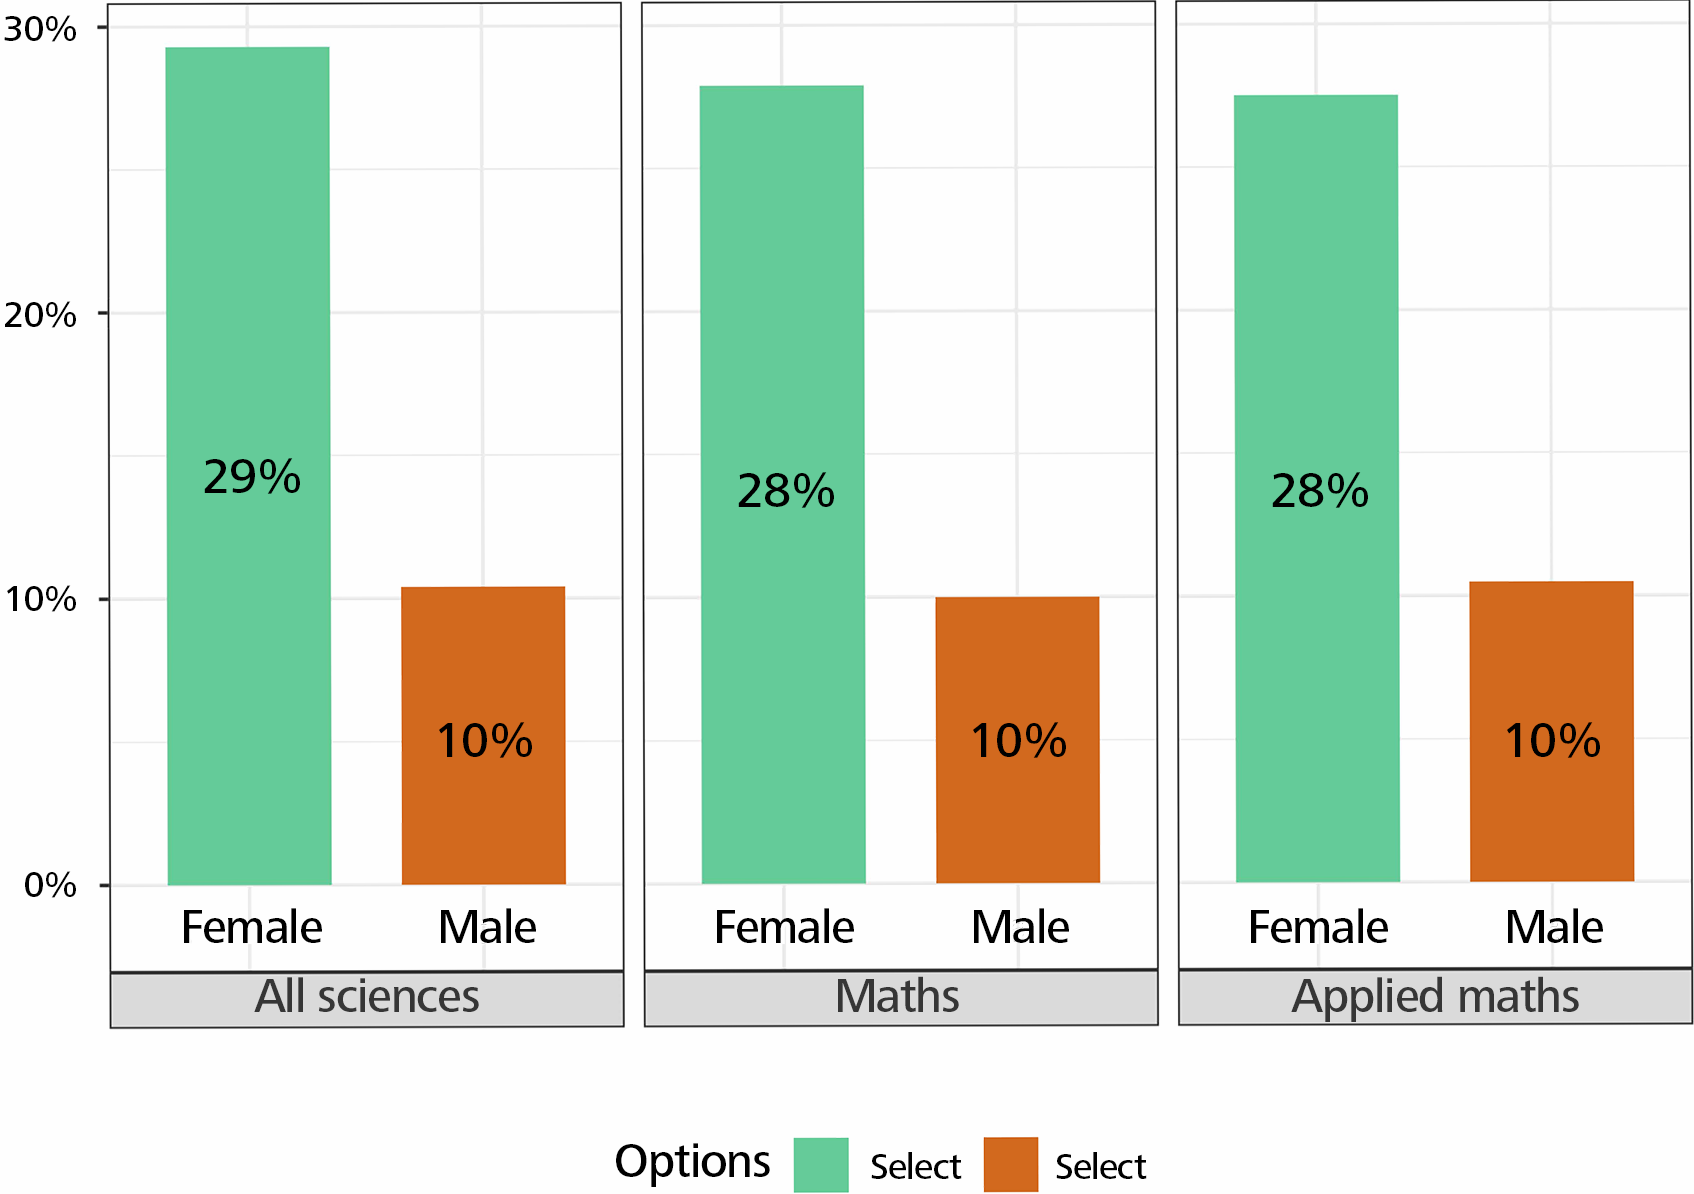
Women are less likely to be editors of journals, particularly in mathematics (Figure 9).
The only situation where the percentage of women is slightly higher than that of men in mathematics is in lectures or interviews aimed at the general public, e.g., on television, in newspapers and magazines.
Career breaks affect women more than men. Women, more often than men, have interrupted their careers to look after their families. Career interruptions have affected the type of work they do, their professional credibility or reputation, more often for women than for men.
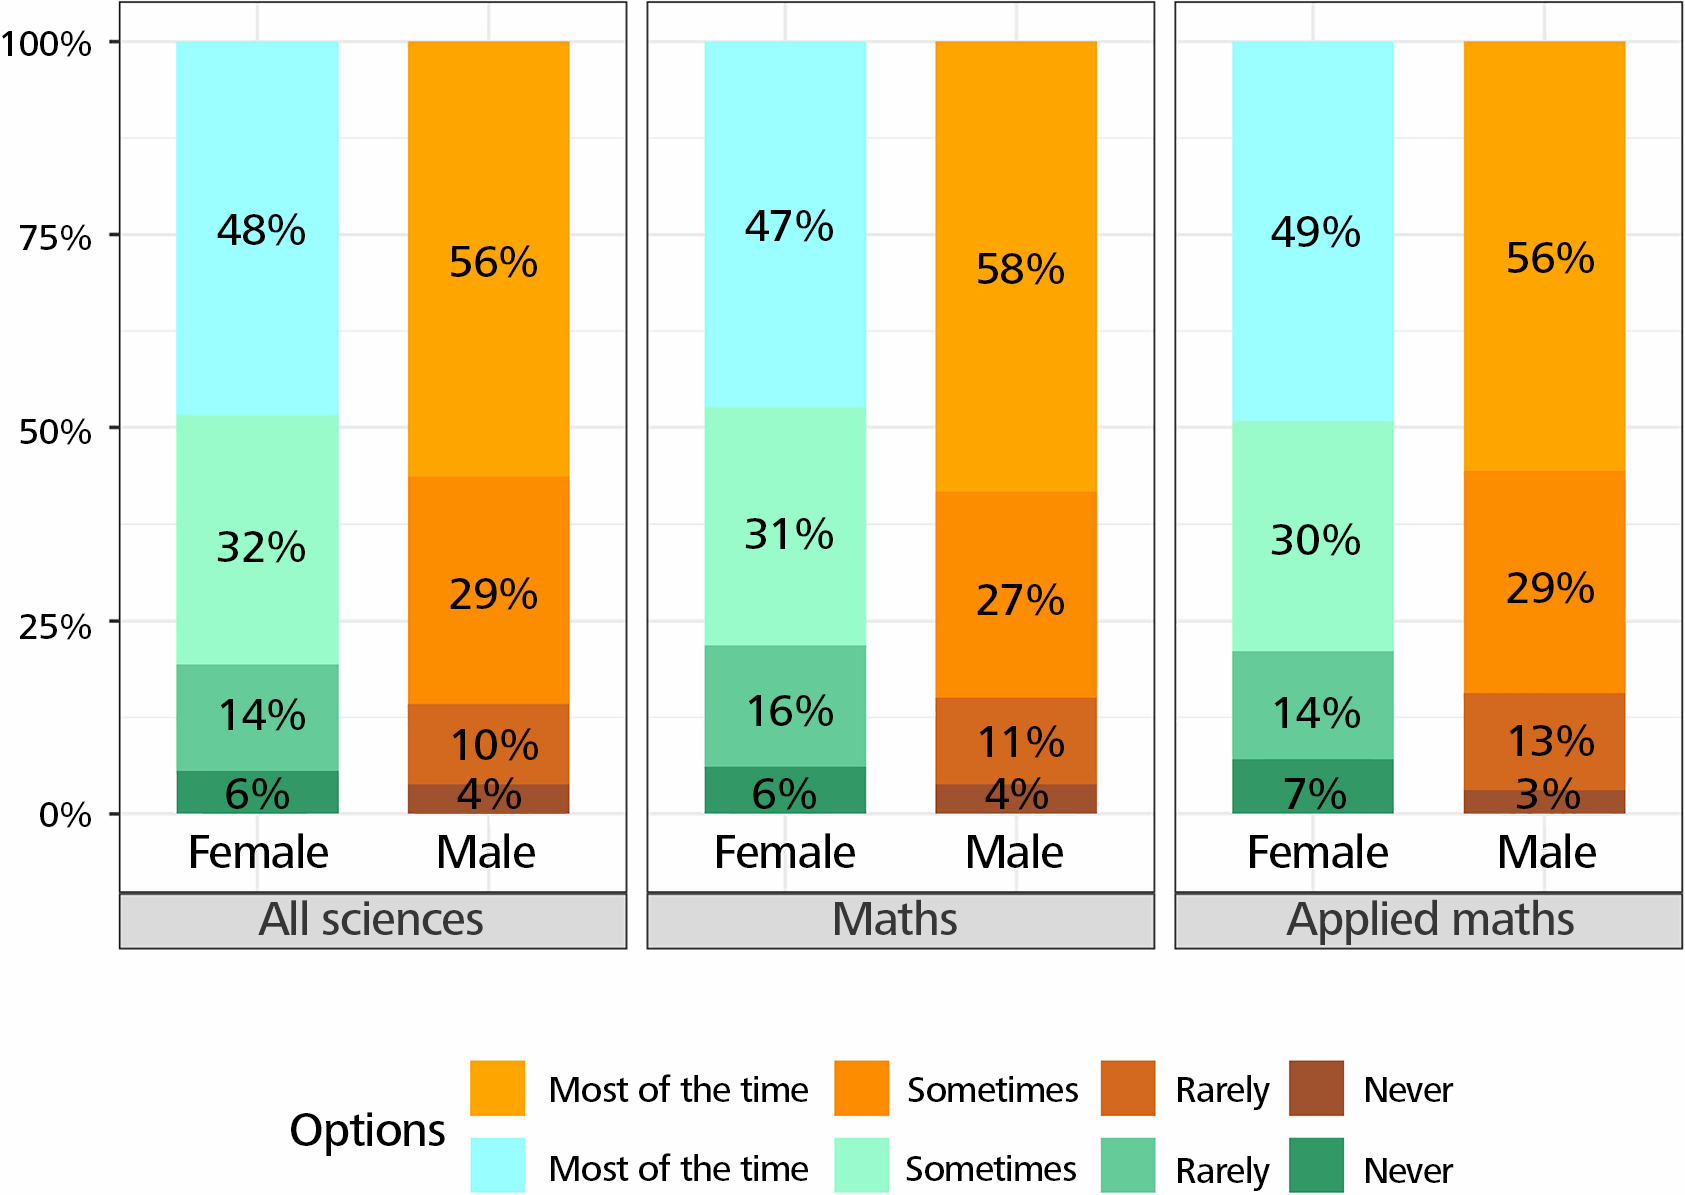
Women feel less comfortable than men in raising concerns with their manager (Figure 10).
Women are more often supervised by women than men in all sciences, but not in mathematics, where the proportion of women supervisors is especially low.
Women and men discuss their work or funding matters in the same way.
Women discuss their interaction with a boss or manager, their personal life, and their family obligations more than men. Men discuss their salary more than women.
Balance of work and family life
Their career influenced their decisions to have children, to marry or enter a similar long-term partnership more often for women than for men.
The spouses of female scientists are more likely to have a high level of education than the spouses of male scientists. More male scientists’ spouses are unemployed, and more female scientists earn less than their spouses. More women than men have a partner or spouse employed in their field.
More men than women had their first child after their doctoral degree.
Maternity or paternity leave is much longer for women than for men. It should be noted that maternity leave is not universal throughout the world and paternity leave is not so common.
Changes in work and career due to parenthood are not the same for women and men. Women are more likely than men to have chosen more flexible working hours, to have spent much less time at work, and to have seen their careers or promotion rates slow significantly (Figure 11).
After having children, more women than men say that they have become more efficient at work.
More women than men changed employers or fields of employment or became stay-at-home parents. The answer is more often “true” for women in all sciences than for women in mathematics.
More men than women answered that there had been no significant change for them when they became a parent.
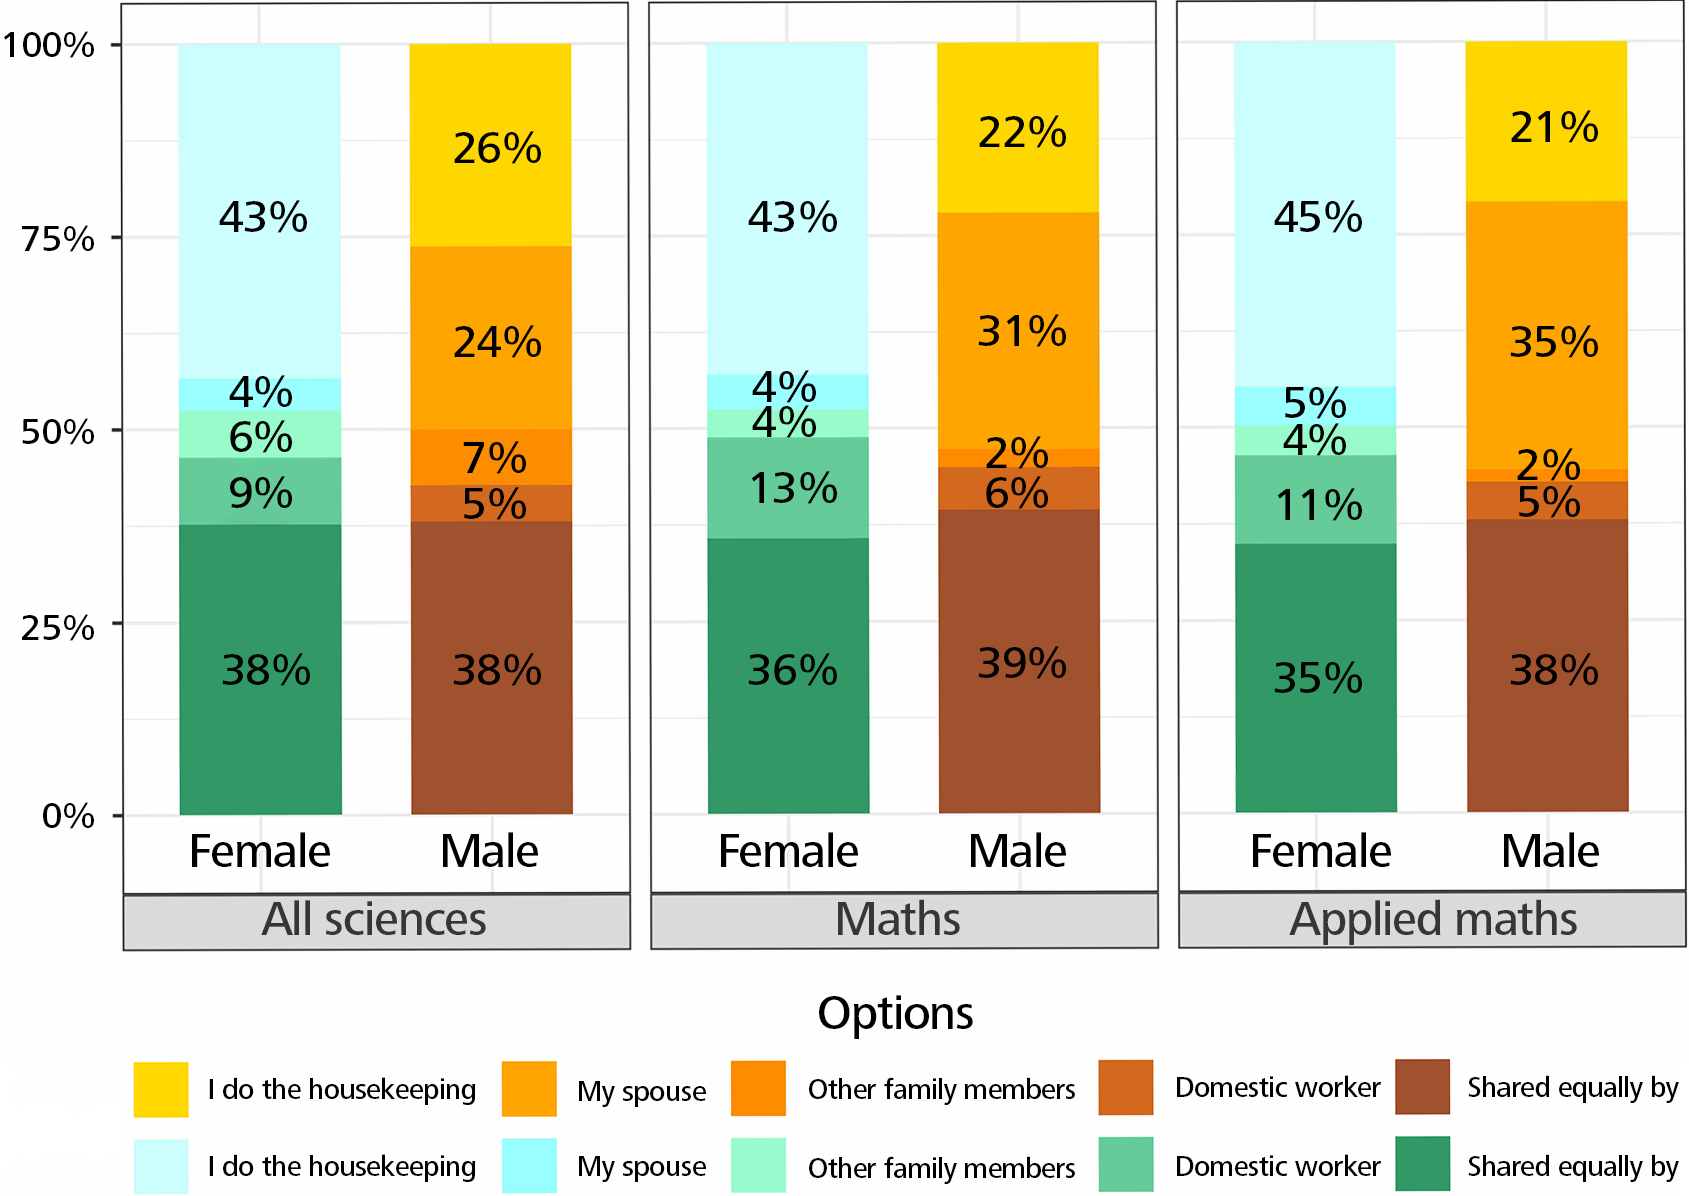
Women take care of the housekeeping much more than men do, especially in mathematics. The percentage of men thinking that household chores are distributed equally within the family is higher than the percentage of women with the same opinion, especially in mathematics (Figure 12).
Women answered more often than men that they were primarily responsible for caring for family members other than children.
Difficulties
Women find it more difficult than men to deliver what is expected of them in their studies or careers (Figure 13).
Women, more often than men, cite pregnancy, raising children, caring for other family members, as the main reason for their difficulties, as well as illness, accident, or death of a close family member. Men, more than women, see divorce or the demands of work as the main reason for their difficulties.
In all the questions regarding the discouragement created by particular difficulties, there was no option where men felt more discouraged than women (see Figure 14 for the option “Interaction with colleagues”).
Men, more than women, never felt discriminated against in the assessment of their achievements (Figure 15). Women, more than men, felt discriminated against because of gender (Figure 16), age, marital status, pregnancy, or responsibilities for children.
Men, more than women, felt discriminated against because of their social status.
The answer regarding sexual harassment at school or at work reveals a huge difference between women and men, not only in terms of personal experience, but also in terms of awareness of what happens to others. Many more men than women have never experienced sexual harassment (Figure 17).
The statement “It happened to me” is overwhelmingly more often true for women than for men (Figure 18).
Women in mathematics compared to women in all sciences were however less likely to have experienced sexual harassment and less likely to answer that it had happened to them.
The statement “I witnessed it happening to someone else” (Figure 19) or “I heard about it happening to someone else” is much more often true for women than for men. For both questions, the percentage of women answering “true” is lower in mathematics or in applied mathematics compared to all sciences.
2 The Gender Gap in Science project and its outcomes
As already mentioned above, the project “A Global Approach to the Gender Gap in Mathematical, Computing, and Natural Sciences: How to Measure It? How to Reduce It?” was an interdisciplinary and international project funded by the International Science Council.5https://council.science Led by the International Mathematical Union (IMU) and the International Union for Pure and Applied Chemistry (IUPAC), it gathered eleven international unions and organisations.6IMU; IUPAC; International Union of Pure and Applied Physics (IUPAP); International Astronomical Union (IAU); International Union of Biological Sciences (IUBS); International Council for Industrial and Applied Mathematics (ICIAM); International Union of History and Philosophy of Science and Technology (IUHPST); United Nations Educational, Scientific and Cultural Organization (UNESCO); Gender in Science, Innovation, Technology and Engineering (GenderInSITE); Organization of Women in Science for the Developing World (OWSD); Association for Computing Machinery (ACM).
This project contributed to the analysis of the gender gap in science from three complementary perspectives:
the Global Survey of Scientists [6 R. Ivie and S. White, Measuring and analyzing the gender gap in science through the global survey of scientists. In [5], pp. 39–81. ], already discussed above;
the study of publication patterns [10 H. Mihaljević and L. Santamaría, Measuring and analyzing the gender gap in science through the joint data-backed study on publication patterns. In [5], pp. 85–153. , 11 H. Mihaljević and L. Santamaría, Mathematics publications and authors’ gender: Learning from the Gender Gap in Science project. Eur. Math. Soc. Mag. 123 (2022), 34–38 ];
the database of good practices [8 R. Kelly and M. Goos, Some initiatives for reducing the gender gap in science: a database of good practices. In [5], pp. 157–176. ];
and has drawn up a list of recommendations.
The results of the Gender Gap in Science project were published in the Gender Gap in Science book [5 C. Guillopé and M.-F. Roy (ed.), A global approach to the gender gap in mathematical, computing, and natural sciences: how to measure it, how to reduce it?. International Mathematical Union, Berlin (2020) ].
Publication patterns
Since successful academic careers are strongly linked to a prolific scholarly record, and scientific publications play a key role in scientific reputation, understanding publication practices in various disciplines is paramount to understanding the gender gap in science.
Including mathematics, astronomy, theoretical physics, and, partially, chemistry, the project analysed millions of publications from 1970 to present day. The databases zbMATH, ADS, and arXiv were chosen as data sources for their specificity and for being comprehensive.
The findings offer deep insights into the dynamics of academic publishing: the percentage of women authoring scientific papers in these disciplines has increased steadily, and the publication profiles of women and men became more and more similar. However, the percentage of women authors of articles in top journals has stagnated in mathematics and theoretical physics and remains around 10%, while it has increased in astronomy and chemistry. Female authors are less numerous in theoretical disciplines while they are more numerous in applied and collaborative fields.
A comprehensive interactive tool on publication patterns has been developed and is accessible to all.7https://gender-publication-gap.f4.htw-berlin.de Available free of charge online, this tool provides customized information on gender-related aspects (authors, editors, etc.) for a long list of journals.
Database of good practices
A selection of initiatives aimed at reducing the gender gap in many countries and disciplines has been identified and a set of dimensions characterizing “good practices” has been applied to all these programmes to explain why they “work.” The database is available and can be enriched interactively with other initiatives.8https://www.mathunion.org/cwm/gender-gap-in-science-database
Recommendations
Recommendations for instructors and parents, scientific organisations and scientific unions have been discussed and compiled. They are available in the booklets published in several languages as part of the project.9https://gender-gap-in-science.org/promotional-materials/
The Standing Committee for Gender Equality in Science
In order to promote gender equality in science, several of the international organisations involved in the “Gender Gap in Science” project, in particular IMU and ICIAM, wish to act together by continuing and expanding the work accomplished to date, in particular by supporting equal access for women and girls to science education, by promoting equal opportunity and treatment for women in their careers. To this end, they set up a Standing Committee for Gender Equality in Science (SCGES) in September 2020.10https://gender-equality-in-science.org Twenty-four scientific unions are members of SCGES in February 2024. The SCGES produces an annual report11https://gender-equality-in-science.org/what-does-the-scges-do/scges-annual-report/ describing its activities and its members’ initiatives in favour of gender equality, and organises a series of webinars.12https://gender-equality-in-science.org/scges-webinar-series/
3 Conclusion
Gender equality, more specifically “Achiev[ing] gender equality and empower[ing] all women and girls” is one of the 17 Sustainable Development Goals adopted by the United Nations Member States in 2015.13https://www.un.org/sustainabledevelopment/development-agenda/ An important gender gap remains however present in all aspects of life everywhere in the world, including, for instance, access to economical resources, political representation, child-rearing and family workload, and stress levels (see, for example, [14 World Economic Forum, Global Gender Gap Report 2022. Coligny/Geneva (2022) https://www.weforum.org/reports/global-gender-gap-report-2022/ (retrieved 13 June 2023) ]). Inequalities between women and men are present everywhere, and always to the detriment of women.
In this context, it is not surprising that the gender gap is also very real in the sciences, and particularly in mathematics and applied mathematics. According to the UNESCO Institute for Statistics [13 UNESCO Institute for Statistics, Women in Science. Fact Sheet No. 55, FS/2019/SCI/55 (2019) https://uis.unesco.org/sites/default/files/documents/fs55-women-in-science-2019-en.pdf (retrieved 17 July 2023) ], less than 30% of the world’s researchers are women, reflecting a clear gender gap in science. There are no similar global statistics for mathematics. However, several contributions are devoted to the history and analysis of the gender gap in mathematics (see [2 B. A. Case and A. M. Leggett (eds.), Complexities: Women in mathematics. Princeton University Press, Princeton, NJ (2005) https://press.princeton.edu/books/paperback/9780691171098/complexities, 4 R. G. Fryer, Jr. and S. D. Levitt, An empirical analysis of the gender gap in mathematics. Am. Econ. J.: Appl. Econ. 2, 210–240 (2010) , 9 T. H. Kjeldsen, N. Oswald and R. Tobies, Mini-workshop: Women in mathematics: historical and modern perspectives. Oberwolfach Rep. 14, 83–131 (2017) , 1 J. L. Beery, S. J. Greenwald and C. Kessel (eds.), Fifty years of women in mathematics: reminiscences, history, and visions for the future of AWM. Assoc. Women Math. Ser. 28, Springer, Cham (2022) ] for further references). Moreover, various national or continental organisations take initiatives to reduce the gender gap in mathematics.14https://www.mathunion.org/cwm
The results of the Global Survey of Scientists illustrate once more the pervasiveness of the gender gap in science. They document several aspects that are not measured on bibliographic metadata, such as family support, access to resources, work-life balance, and sexual harassment.
Our analysis of the Global Survey of Scientists sheds light on many aspects of the gender gap in mathematics compared with the greater scientific community. In the vast majority of questions, there is no significant difference between answers from all sciences and those from mathematics. This in itself is important information, which should encourage self-examination and relevant initiatives within the mathematical community. In a few cases the situation is more positive for mathematics than in all sciences. In a context of widespread sexual harassment in the scientific community [3 Fondation L’Oréal and IPSOS, One in two women scientists say they have experienced sexual harassment at work. (2023) https://www.ipsos.com/en/one-two-women-scientists-say-they-have-experienced-sexual-harassment-work (retrieved 16 September 2023) ], women in mathematics are however less likely to have been sexually harassed. On the other hand, the situation seems to be worse for women in mathematics as it is for all sciences in a whole variety of situations: in particular, during their studies, women received less support from other students; women receive less government income during their working lives; they also have fewer opportunities to serve on editorial boards.
The mathematical community has a responsibility to make special efforts to understand the mechanisms of the gender gap in mathematics and to reduce it. Participation in interdisciplinary and international initiatives to reduce sexual harassment in the scientific community remains essential. Inside the mathematical community, encouraging a women-friendly atmosphere for women during studies and at work, organising equal access to resources, considering specific situations related to parenthood or family care, and promoting the visibility of women in mathematics would already be important steps in the right direction.
Appendix: Methods of data analysis
Data
We use aggregated data collected as part of the Gender Gap project. The data was accessed and extracted via a platform based at the American Institute of Physics, which protects and anonymizes individual data. The platform (Aircloak) ensures anonymity by applying some filters and distortion to the extracted information, which had the effect of limiting the access of the data.
Generally speaking, the databases at our disposal are anonymized, aggregated and available in the form of frequency tables.
It is important to mention that all the data we are working with are categorical, which means that they have a structure of possible answers. Most questions have two possible answers like “yes” or “no”, but we also have questions with three or more possible answers, for instance, the question “Have you encountered sexual harassment at school or work?”. Gender is identified as “female” or “male”, and the Human Development Index (HDI) has four categories: “very high”, “high”, “medium”, and “low.”
Taking into account the aggregated structure of our data, in the first analysis we looked at the gender distribution for each question, and then we applied comparison of proportion tests to assess whether the distribution of the question studied for the two populations of interest (men and women) is statistically equal in each sample and in the sub-samples. This gives an indication of the distribution of individuals and makes it possible to distinguishing the existence of groups sharing similar characteristics in our data.
In addition to these analyses, we perform multivariate analysis using logistic and multinomial aggregated regression models [7 G. James, D. Witten, T. Hastie and R. Tibshirani, An introduction to statistical learning: with applications in R. Springer, New York (2013) ] since most questions have two possible answers (e.g., “yes”, “no”), and a small number of questions have three or more possible answers. The logistic (resp., multinomial) regression model uses a distribution function to model a binary dependent variable (resp., one with multiple nominal values) in relation to other exogenous variables. Using these models, in particular the odds ratio, we can estimate a potential effect of the gender gap that we want to measure given a certain number of confounding variables. It is important to note that these multivariate models are adapted to take into account the aggregated structure of our data.
In all the results we presented in the article to illustrate the gender gap, the multivariate analysis confirmed that the difference we observe between women and men is not due to confounding variables such as age, sector of employment, geographical region, or the country’s HDI (Human Development Index).
Filtered data
Filtering was performed on the original individual data using a zero-mean Gaussian noise and low count filtering to avoid accessing individual answers and infrequent answers. The zero-mean noise filter adds a zero-mean Gaussian noise to the query output tables containing the number, sum, mean, standard deviation, and variance. The noise is proportional to the users most influential on the output and also means that the extracted tables will contain a variation from one to six observations from the raw tables. Noise is proportional to query complexity, meaning that the more complex the query, the more noise is introduced in the output table. For example, a simple query requesting frequency tables for two variables has a base noise layer equal to 2. It modifies values of outlying data, particularly those associated with minimum and maximum values.
Low count filtering eliminates values that do not appear frequently enough or outlying observations. It removes a line when the individual contributing to a single output is too small. More precisely, when the output line contains a number of observations less than or equal to four, the line is automatically hidden.
In some cases, the data may pass the low-count filtering, but there is not enough information to provide the aggregate value requested, such as the average, variance, etc. In this case, the output table will indicate a null value for the lines concerned.
The reported table may contain some lines in italics, which means that the aggregate for that particular line is calculated with a number of observations less or equal to 15. This is also a reminder that the results contain a high relative noise.
In addition, we observe that the more disaggregated the information we want to extract from a single table, the more that table will be penalised. In line with the recommendations of the Aircloak user guide, we construct a query by placing categorical variables with few possible answers first and adding categorical variables with a greater number of possible answers at the end. So instead of having individual data with particular characteristics, we have a group of individuals who share those particular characteristics.
- 1
- 2
See the list of questions (in English) here: http://bit.ly/GSSQuestionList.
- 3
There were too few answers to the third option “prefers not to answer” for them to be analysed in the statistics.
- 4
- 5
- 6
IMU; IUPAC; International Union of Pure and Applied Physics (IUPAP); International Astronomical Union (IAU); International Union of Biological Sciences (IUBS); International Council for Industrial and Applied Mathematics (ICIAM); International Union of History and Philosophy of Science and Technology (IUHPST); United Nations Educational, Scientific and Cultural Organization (UNESCO); Gender in Science, Innovation, Technology and Engineering (GenderInSITE); Organization of Women in Science for the Developing World (OWSD); Association for Computing Machinery (ACM).
- 7
- 8
https://www.mathunion.org/cwm/gender-gap-in-science-database
- 9
- 10
- 11
https://gender-equality-in-science.org/what-does-the-scges-do/scges-annual-report/
- 12
https://gender-equality-in-science.org/scges-webinar-series/
- 13
https://www.un.org/sustainabledevelopment/development-agenda/
- 14
References
- J. L. Beery, S. J. Greenwald and C. Kessel (eds.), Fifty years of women in mathematics: reminiscences, history, and visions for the future of AWM. Assoc. Women Math. Ser. 28, Springer, Cham (2022)
- B. A. Case and A. M. Leggett (eds.), Complexities: Women in mathematics. Princeton University Press, Princeton, NJ (2005) https://press.princeton.edu/books/paperback/9780691171098/complexities
- Fondation L’Oréal and IPSOS, One in two women scientists say they have experienced sexual harassment at work. (2023) https://www.ipsos.com/en/one-two-women-scientists-say-they-have-experienced-sexual-harassment-work (retrieved 16 September 2023)
- R. G. Fryer, Jr. and S. D. Levitt, An empirical analysis of the gender gap in mathematics. Am. Econ. J.: Appl. Econ. 2, 210–240 (2010)
- C. Guillopé and M.-F. Roy (ed.), A global approach to the gender gap in mathematical, computing, and natural sciences: how to measure it, how to reduce it?. International Mathematical Union, Berlin (2020)
- R. Ivie and S. White, Measuring and analyzing the gender gap in science through the global survey of scientists. In [5], pp. 39–81.
- G. James, D. Witten, T. Hastie and R. Tibshirani, An introduction to statistical learning: with applications in R. Springer, New York (2013)
- R. Kelly and M. Goos, Some initiatives for reducing the gender gap in science: a database of good practices. In [5], pp. 157–176.
- T. H. Kjeldsen, N. Oswald and R. Tobies, Mini-workshop: Women in mathematics: historical and modern perspectives. Oberwolfach Rep. 14, 83–131 (2017)
- H. Mihaljević and L. Santamaría, Measuring and analyzing the gender gap in science through the joint data-backed study on publication patterns. In [5], pp. 85–153.
- H. Mihaljević and L. Santamaría, Mathematics publications and authors’ gender: Learning from the Gender Gap in Science project. Eur. Math. Soc. Mag. 123 (2022), 34–38
- C. A. Rivera Martinez, Gender gap in science: Mathematics, applied mathematics, and Africa. Rapport de stage de Master 2 Statistique et Science de Données, CNAM, Paris (2021)
- UNESCO Institute for Statistics, Women in Science. Fact Sheet No. 55, FS/2019/SCI/55 (2019) https://uis.unesco.org/sites/default/files/documents/fs55-women-in-science-2019-en.pdf (retrieved 17 July 2023)
- World Economic Forum, Global Gender Gap Report 2022. Coligny/Geneva (2022) https://www.weforum.org/reports/global-gender-gap-report-2022/ (retrieved 13 June 2023)
Cite this article
Sophie Dabo-Niang, Maria J. Esteban, Colette Guillopé, Marie-Françoise Roy, Aspects of the gender gap in mathematics. Eur. Math. Soc. Mag. 131 (2024), pp. 22–31
DOI 10.4171/MAG/178